
APPLICATIONS+INVESTIGATIONS IN EARTH
18th Edition
ISBN: 9781533902405
Author: Tarbuck
Publisher: Hayden-McNeil Publishing
expand_more
expand_more
format_list_bulleted
Textbook Question
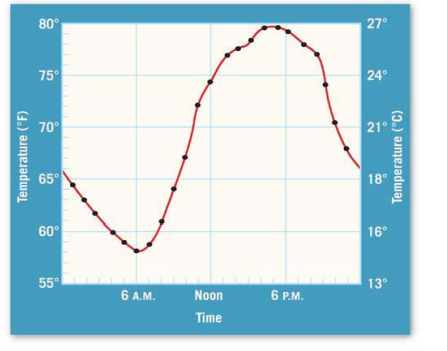
Chapter 14.5, Problem 8A
On Figure 14.10, sketch and label a line that represents a daily temperature graph for a typical cloudy day.
Expert Solution & Answer

Learn your wayIncludes step-by-step video

schedule04:28
Students have asked these similar questions
During computation, you may round your integer data to two decimal places and your percentages and present value factors to four decimal places.
b. Prepare a vertical analysis of the segment data. Round all percents to one
decimal place and round the total percentage to 100 if necessary.
Can you help me fill out a end of period spreadsheet with these adjustemtn data?
Chapter 14 Solutions
APPLICATIONS+INVESTIGATIONS IN EARTH
Ch. 14.1 - Prob. 1ACh. 14.1 - Which part color of visible light has the shortest...Ch. 14.1 - Which part of the electromagnetic...Ch. 14.2 - Prob. 1ACh. 14.2 - Does solar radiation that is reflected and...Ch. 14.2 - What percentage of incoming solar radiation is...Ch. 14.2 - What percentage of incoming solar radiation passes...Ch. 14.2 - Excluding the radiation that is reflected and...Ch. 14.3 - Prob. 1ACh. 14.3 - Does Earths surface emit ultraviolet, visible, or...
Ch. 14.3 - Is nitrogen, the most abundant constituent of the...Ch. 14.3 - Which two gases are most effective in absorbing...Ch. 14.3 - Figure 14.4 illustrates the greenhouse effect in...Ch. 14.4A - Write a statement that summarizes the results of...Ch. 14.4A - Prob. 3ACh. 14.4A - Prob. 4ACh. 14.4A - Prob. 5ACh. 14.4B - Prob. 1ACh. 14.4B - Prob. 2ACh. 14.4B - Prob. 3ACh. 14.4B - Prob. 4ACh. 14.4B - Which city has the highest monthly mean...Ch. 14.4B - Which city has the lowest monthly mean...Ch. 14.4B - Which city has the greatest annual temperature...Ch. 14.4B - Which city reaches its maximum monthly mean...Ch. 14.4B - Which city maintains more uniform temperatures...Ch. 14.4B - Which city is along the west coast, and which city...Ch. 14.5 - Prob. 1ACh. 14.5 - At what time does the warmest temperature occur?Ch. 14.5 - What is the daily temperature range difference...Ch. 14.5 - What is the daily mean temperature average of the...Ch. 14.5 - Why does the coolest temperature of the day occur...Ch. 14.5 - How would cloud cover influence the daily maximum...Ch. 14.5 - How would cloud cover influence the daily minimum...Ch. 14.5 - On Figure 14.10, sketch and label a line that...Ch. 14.6 - Prob. 1ACh. 14.6 - In general, how do surface temperatures vary from...Ch. 14.6 - Do the warmest temperatures occur over continents...Ch. 14.6 - Calculate the annual temperature range along the...Ch. 14.6 - Explain the wide annual range of temperatures in...Ch. 14.6 - Why is the annual temperature range smaller along...Ch. 14.6 - Compare the average monthly temperatures for...Ch. 14.6 - Using the two maps in Figure 14.11, calculate the...Ch. 14.6 - Trace the path of the 40F isotherm over North...Ch. 14.6 - Trace the path of the 70F isotherm over North...Ch. 14.6 - Why do the isotherms in the Southern Hemisphere...Ch. 14.6 - Explain why the entire pattern of isotherms has a...Ch. 14.7 - Prob. 1ACh. 14.7 - Examine Figure 14.12 and write a brief summary of...Ch. 14 - Prob. 1LRCh. 14 - How should an increase in the amount of carbon...Ch. 14 - Based on your results from the albedo experiment...Ch. 14 - Briefly explain how Earths atmosphere is heated.Ch. 14 - Name the two gases that absorb most of Earths...Ch. 14 - Prob. 7LRCh. 14 - In general, do land surfaces heat more or less...Ch. 14 - At what locations continent or marine do we find...Ch. 14 - Why do the middle to high latitudes of the...Ch. 14 - Refer to the graph in Figure 14.13. It shows...
Additional Business Textbook Solutions
Find more solutions based on key concepts
After examining the map and stereogram, draw a line on the map to outline the area illustrated on the stereogra...
Applications and Investigations in Earth Science (8th Edition)
Fill in the temperature values in Table 1-2 for the standard atmosphere from 2000 to 10,000 meters.
Exercises for Weather & Climate (9th Edition)
For a few of the most important past, present, or future robotic missions within the solar system, describe the...
Life in the Universe (4th Edition)
What two body structures contain flexible elastic cartilage?
Anatomy & Physiology
Which of the two planets (Esus or Sulis) do you think will move around the central star in the least amount of ...
Lecture- Tutorials for Introductory Astronomy
For Practice 1.1
Is each change physical or chemical? Which kind of property (chemical or physical) is demonst...
Principles of Chemistry: A Molecular Approach (3rd Edition)
Knowledge Booster

Similar questions
- Refer to the time series data in Problem 1. Using the average of all the historical data as a forecast for the next period, compute the following measures of forecast accuracy: a. Mean absolute error b. Mean squared error c. Mean absolute percentage error d. What is the forecast for week 7? 1. Consider the following time series data: Using the nave method (most recent value) as the forecast for the next week, compute the following measures of forecast accuracy: a. Mean absolute error b. Mean squared error c. Mean absolute percentage error d. What is the forecast for week 7?arrow_forwardThe following 20 observations are for two quantitative variables, x and y. a. Create a scatter chart for these 20 observations. b. Fit a linear trendline to the 20 observations. What can you say about the relationship between the two quantitative variables?arrow_forwardConsider the following time series data: Construct a time series plot. What type of pattern exists in the data? Develop a three-week moving average for this time series. Compute MSE and a forecast for week 7. Use α = 0.2 to compute the exponential smoothing values for the time series. Compute MSE and a forecast for week 7. Compare the three-week moving average forecast with the exponential smoothing forecast using α = 0.2. Which appears to provide the better forecast based on MSE? Explain. Use trial and error to find a value of the exponential smoothing coefficient α that results in a smaller MSE than what you calculated for α = 0.2.arrow_forward
- Consider the following time series data: Construct a time series plot. What type of pattern exists in the data? Develop a three-week moving average for this time series. Compute MSE and a forecast for week 8. Use α = 0.2 to compute the exponential smoothing values for the time series. Compute MSE and a forecast for week 8. Compare the three-week moving average forecast with the exponential smoothing forecast using α = 0.2. Which appears to provide the better forecast based on MSE? Use trial and error to find a value of the exponential smoothing coefficient α that results in a smaller MSE than what you calculated for α = 0.2.arrow_forwardThe figure above is an example of __________. A. line chart B. candlestick chart C. moving average line D. Bollinger bandarrow_forwardIn your opinion, is it important that an organization set standards and measure them monthly? Why or why not?arrow_forward
- 12. Calculate the mean (that is, calculate the arithmetic mean) of the following set of values. Round to the nearest tenth when applicable. 594 374 595 706 541 626 955arrow_forwardConsider the following data. 14,6,−11,−6,5,1014,6,−11,−6,5,10 Copy Data Step 2 of 3: Determine the median of the given data.arrow_forwardThe question is asked to prepare 10 coulmn worksheetarrow_forward
- Of all the events that occur each day, how would you describe those that are recorded in a firms accounting records?arrow_forwardq5- In which of the following charts the X-axis represents outcomes and the Y-axis represents the number of times or the percentage each outcome occurs in the dataset? a. A combo-chart b. A scatter plot c. A histogram d. A boxplotarrow_forwardFill out the percentages column and the yellow and green bottom. Need verification. Show formula/calculationsarrow_forward
arrow_back_ios
SEE MORE QUESTIONS
arrow_forward_ios
Recommended textbooks for you
 Essentials of Business Analytics (MindTap Course ...StatisticsISBN:9781305627734Author:Jeffrey D. Camm, James J. Cochran, Michael J. Fry, Jeffrey W. Ohlmann, David R. AndersonPublisher:Cengage Learning
 Principles of Accounting Volume 2AccountingISBN:9781947172609Author:OpenStaxPublisher:OpenStax College
 Managerial Accounting: The Cornerstone of Busines...AccountingISBN:9781337115773Author:Maryanne M. Mowen, Don R. Hansen, Dan L. HeitgerPublisher:Cengage Learning
 Essentials Of Business AnalyticsStatisticsISBN:9781285187273Author:Camm, Jeff.Publisher:Cengage Learning,
 Cornerstones of Financial AccountingAccountingISBN:9781337690881Author:Jay Rich, Jeff JonesPublisher:Cengage Learning
Essentials of Business Analytics (MindTap Course ...
Statistics
ISBN:9781305627734
Author:Jeffrey D. Camm, James J. Cochran, Michael J. Fry, Jeffrey W. Ohlmann, David R. Anderson
Publisher:Cengage Learning
Principles of Accounting Volume 2
Accounting
ISBN:9781947172609
Author:OpenStax
Publisher:OpenStax College
Managerial Accounting: The Cornerstone of Busines...
Accounting
ISBN:9781337115773
Author:Maryanne M. Mowen, Don R. Hansen, Dan L. Heitger
Publisher:Cengage Learning
Essentials Of Business Analytics
Statistics
ISBN:9781285187273
Author:Camm, Jeff.
Publisher:Cengage Learning,
Cornerstones of Financial Accounting
Accounting
ISBN:9781337690881
Author:Jay Rich, Jeff Jones
Publisher:Cengage Learning