
APPLICATIONS+INVESTIGATIONS IN EARTH
18th Edition
ISBN: 9781533902405
Author: Tarbuck
Publisher: Hayden-McNeil Publishing
expand_more
expand_more
format_list_bulleted
Textbook Question
Chapter 14, Problem 12LR
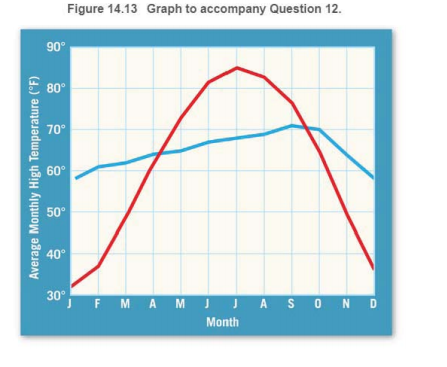
Refer to the graph in Figure 14.13. It shows monthly mean temperatures for two cities at about 40ºN latitude. One city is along the California coast; the other is in central Illinois. Which line on the graph represents the California City, and which represents the city in Illinois? Explain how you determined your answer.
Expert Solution & Answer

Learn your wayIncludes step-by-step video

schedule07:46
Students have asked these similar questions
A researcher wants to estimate the average monthly income of individuals in a certain
city. A random sample of 20 individuals is selected, and their monthly incomes (in
dollars) are recorded as follows:
2,500 2,800 3,000 3,200 3,400
3,500 3,600
4,100 4,200 4,300 4,500 4,600 4,700 4,900
3,700 3,800 4,000
5,000 5,200 5,500
Assuming the incomes are normally distributed, calculate the 90% confidence interval
for the average monthly income of individuals in the city..
Please show all the necessary steps and provide your answer with the appropriate
interpretation.
Hints:
• Calculate the sample mean and sample standard deviation.
. Determine the critical value (t-value) for a 90% confidence level.
• Calculate the margin of error using the critical value and sample standard
deviation.
• Calculate the lower and upper bounds of the confidence interval using the sample
mean and margin of error.
• Interpret the confidence interval in the context of the problem.
I
You have been commissioned to estimate the demand curve for admission to Lake
Saint- Michel, a recreational fishing site in France. To do this, you spend a day
surveying visitor to the site.
You divide the area around the site into 3 zones. You ask each person you interview
where they come from. Based on that information, and figures on annual attendance
at the park, you are able to calculate the annual number of visitors from each zone.
Your data are shown below.
For each zone, the total travel cost
1 euro per person for each kilometer traveled
to and from the site.
One-Way
Distance from
Park
Origin
Total
Number of
Population
Users
(in kilometer)
A
6.25
125,000
18,750
B
12.5
937,500
93,750
18.75
1,250,000
62,500
b.
Suppose a fee were charged to enter the site. What is the per capita
demand function for each origin? Please express the relationship in
an equation.
Calculate the number of visitors and consumer surplus if no fee were
C.
charged to enter the park.
You have been commissioned to estimate the demand curve for admission to Lake
Saint- Michel, a recreational fishing site in France. To do this, you spend a day
surveying visitor to the site.
You divide the area around the site into 3 zones. You ask each person you interview
where they come from. Based on that information, and figures on annual attendance
at the park, you are able to calculate the annual number of visitors from each zone.
Your data are shown below.
For each zone, the total travel cost
1 euro per person for each kilometer traveled
to and from the site.
One-Way
Distance from
Park
Origin
Total
Number of
Population
Users
(in kilometer)
A
6.25
125,000
18,750
B
12.5
937,500
93,750
18.75
1,250,000
62,500
а.
Express the relationship between per capita visitation rate (R) and travel
cost (TC) in an equation.
b.
Suppose a fee were charged to enter the site. What is the per capita
demand function for each origin? Please express the relationship in
an equation.
Calculate the number…
Chapter 14 Solutions
APPLICATIONS+INVESTIGATIONS IN EARTH
Ch. 14.1 - Prob. 1ACh. 14.1 - Which part color of visible light has the shortest...Ch. 14.1 - Which part of the electromagnetic...Ch. 14.2 - Prob. 1ACh. 14.2 - Does solar radiation that is reflected and...Ch. 14.2 - What percentage of incoming solar radiation is...Ch. 14.2 - What percentage of incoming solar radiation passes...Ch. 14.2 - Excluding the radiation that is reflected and...Ch. 14.3 - Prob. 1ACh. 14.3 - Does Earths surface emit ultraviolet, visible, or...
Ch. 14.3 - Is nitrogen, the most abundant constituent of the...Ch. 14.3 - Which two gases are most effective in absorbing...Ch. 14.3 - Figure 14.4 illustrates the greenhouse effect in...Ch. 14.4A - Write a statement that summarizes the results of...Ch. 14.4A - Prob. 3ACh. 14.4A - Prob. 4ACh. 14.4A - Prob. 5ACh. 14.4B - Prob. 1ACh. 14.4B - Prob. 2ACh. 14.4B - Prob. 3ACh. 14.4B - Prob. 4ACh. 14.4B - Which city has the highest monthly mean...Ch. 14.4B - Which city has the lowest monthly mean...Ch. 14.4B - Which city has the greatest annual temperature...Ch. 14.4B - Which city reaches its maximum monthly mean...Ch. 14.4B - Which city maintains more uniform temperatures...Ch. 14.4B - Which city is along the west coast, and which city...Ch. 14.5 - Prob. 1ACh. 14.5 - At what time does the warmest temperature occur?Ch. 14.5 - What is the daily temperature range difference...Ch. 14.5 - What is the daily mean temperature average of the...Ch. 14.5 - Why does the coolest temperature of the day occur...Ch. 14.5 - How would cloud cover influence the daily maximum...Ch. 14.5 - How would cloud cover influence the daily minimum...Ch. 14.5 - On Figure 14.10, sketch and label a line that...Ch. 14.6 - Prob. 1ACh. 14.6 - In general, how do surface temperatures vary from...Ch. 14.6 - Do the warmest temperatures occur over continents...Ch. 14.6 - Calculate the annual temperature range along the...Ch. 14.6 - Explain the wide annual range of temperatures in...Ch. 14.6 - Why is the annual temperature range smaller along...Ch. 14.6 - Compare the average monthly temperatures for...Ch. 14.6 - Using the two maps in Figure 14.11, calculate the...Ch. 14.6 - Trace the path of the 40F isotherm over North...Ch. 14.6 - Trace the path of the 70F isotherm over North...Ch. 14.6 - Why do the isotherms in the Southern Hemisphere...Ch. 14.6 - Explain why the entire pattern of isotherms has a...Ch. 14.7 - Prob. 1ACh. 14.7 - Examine Figure 14.12 and write a brief summary of...Ch. 14 - Prob. 1LRCh. 14 - How should an increase in the amount of carbon...Ch. 14 - Based on your results from the albedo experiment...Ch. 14 - Briefly explain how Earths atmosphere is heated.Ch. 14 - Name the two gases that absorb most of Earths...Ch. 14 - Prob. 7LRCh. 14 - In general, do land surfaces heat more or less...Ch. 14 - At what locations continent or marine do we find...Ch. 14 - Why do the middle to high latitudes of the...Ch. 14 - Refer to the graph in Figure 14.13. It shows...
Additional Business Textbook Solutions
Find more solutions based on key concepts
Use Figure 4-7 to describe how the temperature gradients differ between January and July. At approximately what...
Exercises for Weather & Climate (9th Edition)
With what geologic feature are the earthquakes in the mid-Atlantic associated?
Applications and Investigations in Earth Science (8th Edition)
Two culture media were inoculated with four different bacteria. After incubation, the following results were ob...
Microbiology: An Introduction (13th Edition)
What is the reducing agent in the following reaction?
2 Br –– (aq) + H2 O2 (aq) + 2 H+ (aq) → Br2 (aq) + 2 H2 ...
Chemistry: The Central Science (14th Edition)
What is the difference between cellular respiration and external respiration?
Human Physiology: An Integrated Approach (8th Edition)
Knowledge Booster

Similar questions
- In your opinion, is it important that an organization set standards and measure them monthly? Why or why not?arrow_forwardAs was discussed in the Analytics in Action from Chapter 2, the U.S. Census Bureau is a leading source of quantitative data related to the people and economy of the United States. The crosstabulation below represents the number of households (1,000s) and the household income by the highest level of education for the head of household (U.S. Census Bureau web site, 2013). Use this crosstabulation to answer the following questions. a. Develop a joint probability table. b. What is the probability the head of one of these households has a masters degree or higher education? c. What is the probability a household is headed by someone with a high school diploma earning 100,000 or more? d. What is the probability one of these households has an income below 25,000? e. What is the probability a household is headed by someone with a bachelors degree earning less than 25,000? f. Are household income and educational level independent?arrow_forwardCity A ranked fourth according to the size. City B ranked first with a population of 20 m. Find the city A population?arrow_forward
- The accompanying data file shows the square footage and associated property taxes for 20 homes in an affluent suburb 30 miles outside of New York City. Click here for the Excel Data File a. Estimate a home's property taxes as a linear function of the size of the home (measured by its square footage). Note: Round your answers to 2 decimal places. Property taxes = + Size b. What proportion of the sample variation in property taxes is explained by the home's size? Note: Round your answer into 2 decimal places. Proportion of the sample variation % c. What proportion of the sample variation in property taxes is unexplained by the home's size? Note: Round your answer into 2 decimal places. Proportion of the sample variation %arrow_forwardMay I ask for an explanation and solution to the question for a better understanding. Thank you! 13. What is the Sculler's acid test ratio at December 31, 2021? a. 0.672 to 1 b. 0.756 to 1 c. 1.000 to 1 d. 1.767 to 1arrow_forwardYou may need to use the appropriate appendix table or technology to answer this question. A government agency provides the number of miles that residents of the 75 largest metropolitan areas travel per day in a car. Suppose that for a simple random sample of 50 City A residents the mean is 22.9 miles a day and the standard deviation is 8.7 miles a day, and for an independent simple random sample of 40 City B residents the mean is 18.6 miles a day and the standard deviation is 7.7 miles a day. (a) What is the point estimate of the difference between the mean number of miles that City A residents travel per day and the mean number of miles that City B residents travel per day? (Use City A − City B.) __________ mi/dayarrow_forward
- The following table shows an example of gross domestic product values for five countries over six years in equivalent U.S. dollars (). a. How could you improve the readability of this table? b. The file GDPyears contains sample data from the United Nations Statistics Division on 30 countries and their GDP values from Year 1 to Year 6 in US. Create a table that provides all these data for a user. Format the table to make it as easy to read as possible. Hint: It is generally not important for the user to know GDP to an exact dollar figure. It is typical to present GDP values in millions or billions of dollars.arrow_forwardThe following 20 observations are for two quantitative variables, x and y. a. Create a scatter chart for these 20 observations. b. Fit a linear trendline to the 20 observations. What can you say about the relationship between the two quantitative variables?arrow_forwardHow much is the NOLCO in Year B? How much is the NOLCO in Year C? How much is the NOLCO in Yeat E?arrow_forward
- May I ask for a solution and explanation to the problem for a better understanding. Thank you! 2. Using Carrot Corp data. What is the Acid-test ratio for years 1 and 2 respectively? a. 3; 2.80 b. 2.80; 3 c. 2.6; 4 d. 4; 2.6arrow_forwardthink about the ways in which Texas is currently changing and how that will affect the state 20 years into the future. You may use these questions to begin your analysis but you are not limited to them Have the politics of the state shifted in Texas? What evidence do you have that your predictions are accurate and fact-based? What are the most important political issues facing Texas in the future?arrow_forwardThe daily water consumption for an Ohio community is normally distributed with a mean consumption of 842,061 gallons and a standard deviation of 87,901 gallons. The community water system will experience a noticeable drop in water pressure when the daily water consumption exceeds 991,628 gallons. What is the probability of experiencing such a drop in water pressure? (Round your answer to 4 decimal places. Round Z-scores to 2 decimal places.)arrow_forward
arrow_back_ios
SEE MORE QUESTIONS
arrow_forward_ios
Recommended textbooks for you
 Essentials of Business Analytics (MindTap Course ...StatisticsISBN:9781305627734Author:Jeffrey D. Camm, James J. Cochran, Michael J. Fry, Jeffrey W. Ohlmann, David R. AndersonPublisher:Cengage Learning
 Principles of Accounting Volume 2AccountingISBN:9781947172609Author:OpenStaxPublisher:OpenStax College
Essentials of Business Analytics (MindTap Course ...
Statistics
ISBN:9781305627734
Author:Jeffrey D. Camm, James J. Cochran, Michael J. Fry, Jeffrey W. Ohlmann, David R. Anderson
Publisher:Cengage Learning
Principles of Accounting Volume 2
Accounting
ISBN:9781947172609
Author:OpenStax
Publisher:OpenStax College