
Essentials Of Statistics For Business & Economics
9th Edition
ISBN: 9780357045435
Author: David R. Anderson, Dennis J. Sweeney, Thomas A. Williams, Jeffrey D. Camm, James J. Cochran
Publisher: South-Western College Pub
expand_more
expand_more
format_list_bulleted
Concept explainers
Videos
Textbook Question
Chapter 14.7, Problem 42E
Annual Sales and Salesforce. A regression model relating x, number of salespersons at a branch office, to y, annual sales at the office (in thousands of dollars) provided the following computer output from a
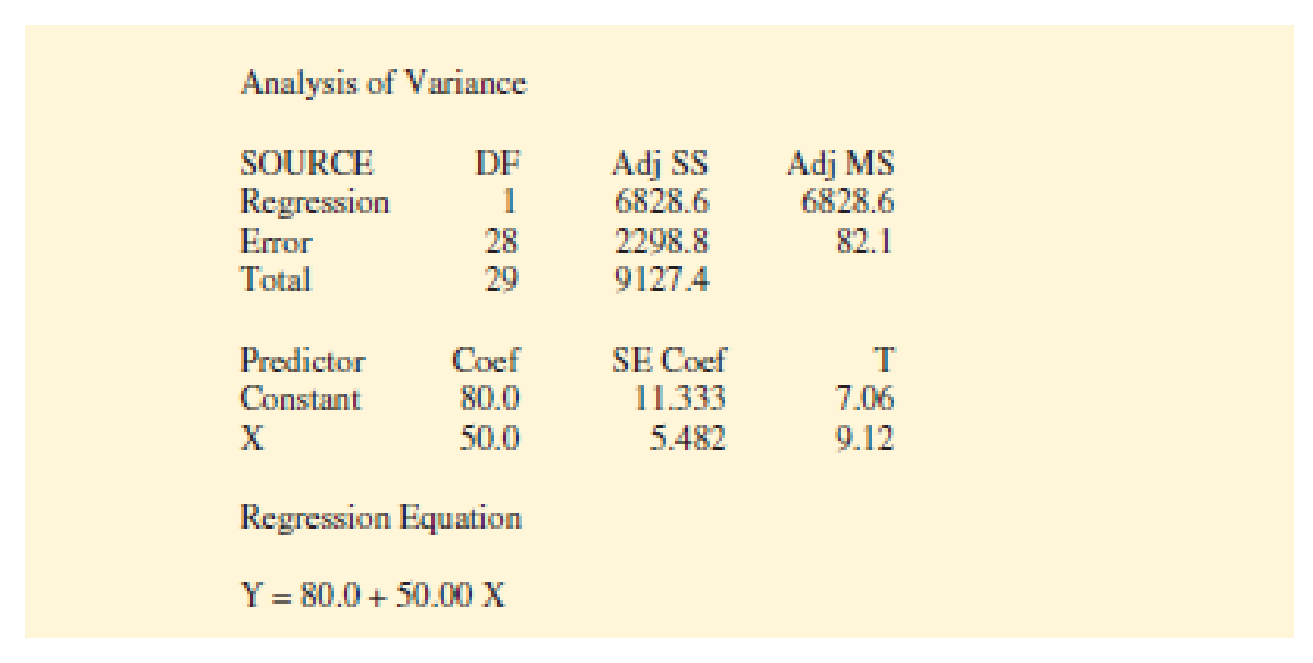
- a. Write the estimated regression equation.
- b. How many branch offices were involved in the study?
- c. Compute the F statistic and test the significance of the relationship at a .05 level of significance.
- d. Predict the annual sales at the Memphis branch office. This branch employs 12 salespersons.
Expert Solution & Answer
Want to see the full answer?
Check out a sample textbook solution
Chapter 14 Solutions
Essentials Of Statistics For Business & Economics
Ch. 14.2 - Given are five observations for two variables, x...Ch. 14.2 - Given are five observations for two variables, x...Ch. 14.2 - Given are five observations collected in a...Ch. 14.2 - Retail and Trade: Female Managers. The following...Ch. 14.2 - Production Line Speed and Quality Control. Brawdy...Ch. 14.2 - The National Football League (NFL) records a...Ch. 14.2 - Sales Experience and Performance. A sales manager...Ch. 14.2 - Broker Satisfaction. The American Association of...Ch. 14.2 - Estimating Landscaping Expenditures. David’s...Ch. 14.2 - Age and the Price of Wine. For a particular red...
Ch. 14.2 - Laptop Ratings. To help consumers in purchasing a...Ch. 14.2 - Stock Beta. In June of 2016, Yahoo Finance...Ch. 14.2 - Auditing Itemized Tax Deductions. To the Internal...Ch. 14.2 - Distance and Absenteeism. A large city hospital...Ch. 14.3 - 15. The data from exercise 1...Ch. 14.3 - Prob. 16ECh. 14.3 - The data from exercise 3 follow.
The estimated...Ch. 14.3 - Price and Quality of Headphones. The following...Ch. 14.3 - Prob. 19ECh. 14.3 - Price and Weight of Bicycles. Bicycling, the...Ch. 14.3 - Cost Estimation. An important application of...Ch. 14.3 - Prob. 22ECh. 14.5 - The data from exercise 1 follow.
Compute the mean...Ch. 14.5 - The data from exercise 2 follow.
Compute the mean...Ch. 14.5 - The data from exercise 3 follow.
What is the...Ch. 14.5 - Headphones Conclusion. In exercise 18, the data on...Ch. 14.5 - College CPA and Salary. Do students with higher...Ch. 14.5 - Broker Satisfaction Conclusion. In exercise 8,...Ch. 14.5 - Cost Estimation Conclusion. Refer to exercise 21,...Ch. 14.5 - Significance of Fleet Size on Rental Car Revenue....Ch. 14.5 - Significance of Racing Bike Weight on Price. In...Ch. 14.6 - The data from exercise 1 follow. xi 1 2 3 4 5 yi 3...Ch. 14.6 - Prob. 33ECh. 14.6 - 34. The data from exercise 3...Ch. 14.6 - Restaurant Lines. Many small restaurants in...Ch. 14.6 - 36. In exercise 7, the data on y = annual sales ($...Ch. 14.6 - In exercise 13, data were given on the adjusted...Ch. 14.6 - Prob. 38ECh. 14.6 - Entertainment Spend. The Wall Street Journal asked...Ch. 14.7 - Apartment Selling Price. The commercial division...Ch. 14.7 - Computer Maintenance. Following is a portion of...Ch. 14.7 - Annual Sales and Salesforce. A regression model...Ch. 14.7 - Estimating Setup Time. Sherry is a production...Ch. 14.7 - Auto Racing Helmet. Automobile racing,...Ch. 14.8 - Given are data for two variables, x and y. a....Ch. 14.8 - Prob. 46ECh. 14.8 - Restaurant Advertising and Revenue. Data on...Ch. 14.8 - Experience and Sales. Refer to exercise 7, where...Ch. 14.8 - Buy Versus Rent. Occasionally, it has been the...Ch. 14.9 - Consider the following data for two variables, x...Ch. 14.9 - Consider the following data for two variables, x...Ch. 14.9 - Predicting Charity Expenses. Charity Navigator is...Ch. 14.9 - Supermarket Checkout Lines. Retail chain Kroger...Ch. 14.9 - Valuation of a Major League Baseball Team. The...Ch. 14 - 55. Does a high value of r2 imply that two...Ch. 14 - Prob. 56SECh. 14 - What is the purpose of testing whether 1 = 0? If...Ch. 14 - Stock Market Performance. The Dow Jones Industrial...Ch. 14 - Home Sire and Price. Is the number of square feet...Ch. 14 - Online Education. One of the biggest changes in...Ch. 14 - Machine Maintenance. Jensen Tire & Auto is in the...Ch. 14 - Production Rate and Quality Control. In a...Ch. 14 - Absenteeism and Location. A sociologist was hired...Ch. 14 - Bus Maintenance. The regional transit authority...Ch. 14 - Studying and Grades. A marketing professor at...Ch. 14 - Market Beta. Market betas for individual stocks...Ch. 14 - Income and Percent Audited. The Transactional...Ch. 14 - Used Car Mileage and Price. The Toyota Camry is...Ch. 14 - One measure of the risk or volatility of an...Ch. 14 - As part of a study on transportation safety, the...Ch. 14 - Consumer Reports tested 166 different...Ch. 14 - When trying to decide what car to buy, real value...Ch. 14 - Buckeye Creek Amusement Park is open from the...
Knowledge Booster


Learn more about
Need a deep-dive on the concept behind this application? Look no further. Learn more about this topic, statistics and related others by exploring similar questions and additional content below.Similar questions
- For the following exercises, use Table 4 which shows the percent of unemployed persons 25 years or older who are college graduates in a particular city, by year. Based on the set of data given in Table 5, calculate the regression line using a calculator or other technology tool, and determine the correlation coefficient. Round to three decimal places of accuracyarrow_forwardCable TV The following table shows the number C. in millions, of basic subscribers to cable TV in the indicated year These data are from the Statistical Abstract of the United States. Year 1975 1980 1985 1990 1995 2000 C 9.8 17.5 35.4 50.5 60.6 60.6 a. Use regression to find a logistic model for these data. b. By what annual percentage would you expect the number of cable subscribers to grow in the absence of limiting factors? c. The estimated number of subscribers in 2005 was 65.3million. What light does this shed on the model you found in part a?arrow_forwardFor the following exercises, consider the data in Table 5, which shows the percent of unemployed in a city ofpeople25 years or older who are college graduates is given below, by year. 41. Based on the set of data given in Table 7, calculatethe regression line using a calculator or othertechnology tool, and determine the correlationcoefficient to three decimal places.arrow_forward
arrow_back_ios
arrow_forward_ios
Recommended textbooks for you

 Glencoe Algebra 1, Student Edition, 9780079039897...AlgebraISBN:9780079039897Author:CarterPublisher:McGraw Hill
 Functions and Change: A Modeling Approach to Coll...AlgebraISBN:9781337111348Author:Bruce Crauder, Benny Evans, Alan NoellPublisher:Cengage Learning
 Algebra and Trigonometry (MindTap Course List)AlgebraISBN:9781305071742Author:James Stewart, Lothar Redlin, Saleem WatsonPublisher:Cengage Learning
Glencoe Algebra 1, Student Edition, 9780079039897...
Algebra
ISBN:9780079039897
Author:Carter
Publisher:McGraw Hill
Functions and Change: A Modeling Approach to Coll...
Algebra
ISBN:9781337111348
Author:Bruce Crauder, Benny Evans, Alan Noell
Publisher:Cengage Learning
Algebra and Trigonometry (MindTap Course List)
Algebra
ISBN:9781305071742
Author:James Stewart, Lothar Redlin, Saleem Watson
Publisher:Cengage Learning
Correlation Vs Regression: Difference Between them with definition & Comparison Chart; Author: Key Differences;https://www.youtube.com/watch?v=Ou2QGSJVd0U;License: Standard YouTube License, CC-BY
Correlation and Regression: Concepts with Illustrative examples; Author: LEARN & APPLY : Lean and Six Sigma;https://www.youtube.com/watch?v=xTpHD5WLuoA;License: Standard YouTube License, CC-BY