
Videos
A technician is often asked to read graphs drawn by a machine. The machine records measurements by plot ting them on a graph. Any field in which quality control or continuous information is needed might use this way of recording measurements. Illustration 4 shows a microbarograph used by the weather service to record atmospheric pressure in inches. For example, the reading on Monday at 8:00 p.m. was 29.34 in.
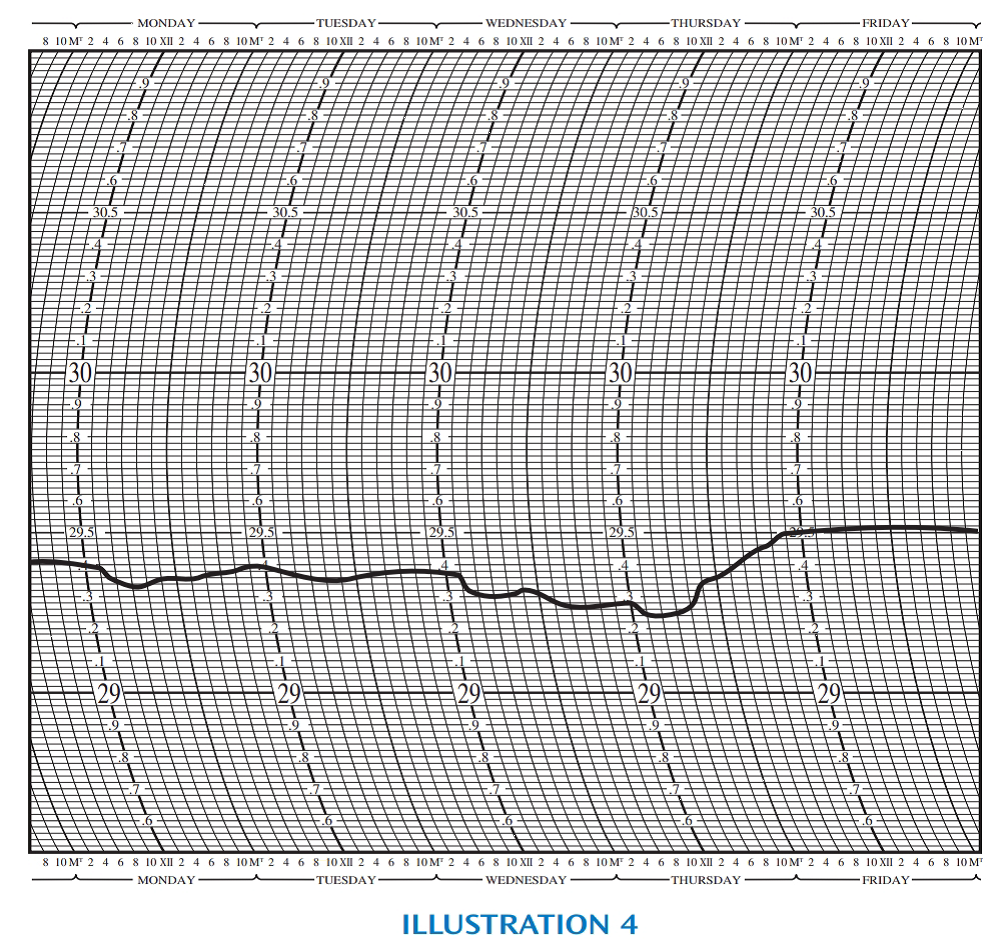
ILLUSTRATION 4
Microbarograph (atmospheric pressure in inches)
Use the microbarograph in Illustration 4 to answer Exercises 4–8.
What was the highest atmospheric pressure recorded? When was it recorded?

Trending nowThis is a popular solution!

Chapter 15 Solutions
Bundle: Elementary Technical Mathematics, Loose-leaf Version, 12th + WebAssign Printed Access Card, Single-Term


 Mathematics For Machine TechnologyAdvanced MathISBN:9781337798310Author:Peterson, John.Publisher:Cengage Learning,
 Glencoe Algebra 1, Student Edition, 9780079039897...AlgebraISBN:9780079039897Author:CarterPublisher:McGraw Hill
 Holt Mcdougal Larson Pre-algebra: Student Edition...AlgebraISBN:9780547587776Author:HOLT MCDOUGALPublisher:HOLT MCDOUGAL