
Videos
A hygrothermograph is used by the weather services to record temperature and relative humidity (see Illustration 5). The lower part of the graph is used to measure relative humidity from 0% to 100%. The upper part of the graph is used to measure temperature from
F to
F. For example, at 8:00 P.M., the temperature was
F, and the relative humidity was 82%.
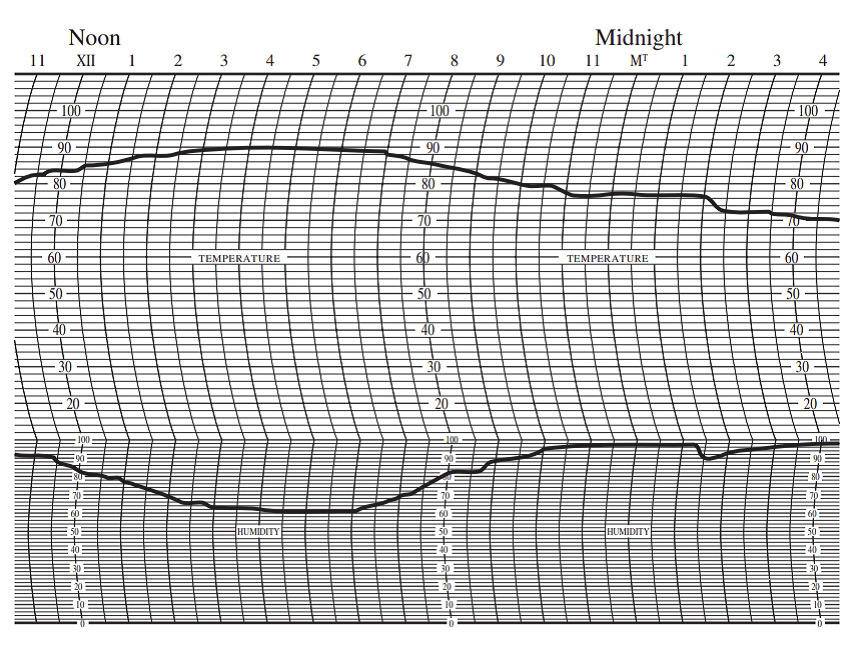
ILLUSTRATION 5
Hygrothermography (temperature in
Use the hygrothermograph in Illustration 5 to answer Exercises 9–14.
What was the lowest relative humidity recorded?
Want to see the full answer?
Check out a sample textbook solution
Chapter 15 Solutions
Bundle: Elementary Technical Mathematics, Loose-leaf Version, 12th + WebAssign Printed Access Card, Single-Term


- Read the decimal-inch measurement on the vernier height gage in Figure 41-2.arrow_forwardUsing all the data in the image, create the following graphs: 1. Histogram 2. Frequency Ogive 3. Box Plotarrow_forwardIllustration 8,5. Table 8.5 gives the highest and lowest prices of silver during the period 1962-69. Plot these as a graph. TABLE 8.5. PRICES OF SILVER-BOMBAY (Rs per kilogram) Highest Lowest 1962-63 242 187 1963-64 269 222 1964-65 281 244 1965-66 406 281 1966-67 385 336 1967-68 565 346 1968-69 633 508arrow_forward
- Roy has surveyed their 30 classmates about the number of pets in their household and received the following data: Number of pets Frequency 0 5 1 2 2 4 3 3 4 4 5 8 6 4 Total: 30 Construct a frequency polygon: I have to do a graph on this one.arrow_forwardMake 2 bar graph using this data one for bpm and one for resarrow_forwardThe amount of electricity used in a typical all-electric home is shown in the circle graph. If, in a certain month, a home used 2,000 kwh, find the amounts of electricity used by the water heater from the grapharrow_forward
- Use the monthly average Rainfall and Temperature data to plot a typical Temperature-Rainfall graph (one graph, different plots and labels on either y-axis) of Port Moresby.arrow_forwardConsider the graph below and Find the average of the temperatures shown for the months of January, September, and October.arrow_forwardThe graph below is the shoe sizes and heights (in inches) of 14 girls. Determine the strength of the relationship between shoe sizes and heights. Figure 2. Shoe Size 67.5959606162636465x shoe sizey Height x y graph A. Strong negative relationship B. Perfect negative relationship C. Perfect positive relationship D. Strong positive relationship Click to select your answer and then click Check Answer.arrow_forward
 Mathematics For Machine TechnologyAdvanced MathISBN:9781337798310Author:Peterson, John.Publisher:Cengage Learning,
 Glencoe Algebra 1, Student Edition, 9780079039897...AlgebraISBN:9780079039897Author:CarterPublisher:McGraw Hill