Videos
A fifth-grade class is wondering ¡f girls’ names tend to be longerthan boys’ names. Table 15.6 shows the names of all thefifth-grade girls and boys at the school.
Table 15.6 Fifth-grader names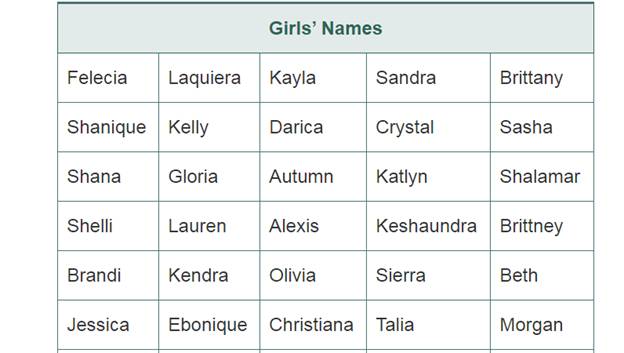
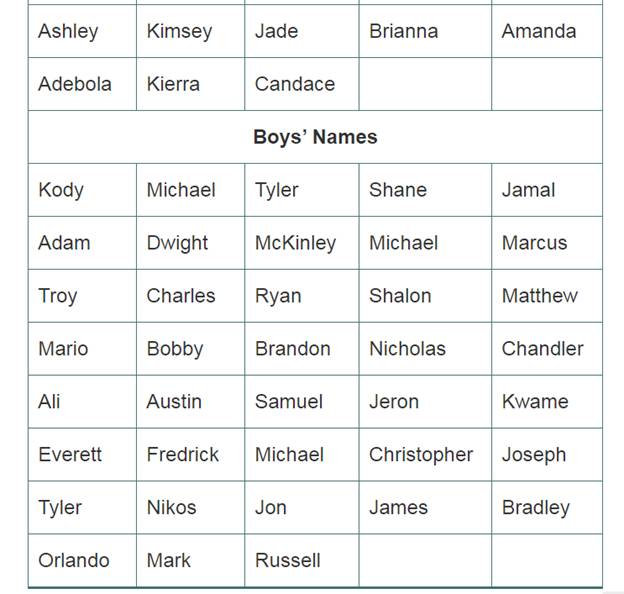
a. Display the lengths of the fifth-grade girls’ and boys’ names in dot plots. Compare the dot plots.
b. Write and answer at least four questions about your dot plots from part (a), including at least one question at each of the three graph-reading levels discussed in Section 15.2 (Read the data, Read between the data, and Read beyond the data).
c. Display the lengths of the fifth-grade girls’ and boys’ names in box plots.
d. Compare the box plots from part (c). What do they tell you about the fifth-grade girls’ and boys’ names?
Want to see the full answer?
Check out a sample textbook solution
Chapter 15 Solutions
Mathematics for Elementary Teachers with Activities Plus MyLab Math -- Title-Specific Access Card Package (5th Edition)


- part e asks to choose one of the box plotsarrow_forwardA researcher measures the relationship between education (in years) and investment gains (in thousands of dollars). Answer the following questions based on the results provided. SP = 16.25. a. Create a scatter plot of the data & Calculate r and r2b. Report results in APA style & What do results mean? Education Investment Gains 14 8 12 11 9 10 18 14arrow_forward(b) Plot the following ordered pairs on a recta (1,-12.2),(2,-4.4),(3,9.4) (4,28.1),(5,49.8),(6,58.3) (7,62.2),(8,57.4),(9,45.7) (10,23.1),(11,5.4),(12,-11.7)arrow_forward
- Which value of r would be appropriate for the scatter plot shown? 1. 0.4 2. 0.0 3. -0.4 4. 0.9arrow_forwardMs. Hammell took some time to toss a die during her lunch break and ended up with the following results. Number Times Rolled 1 5 2 2 3 3 4 1 5 8 6 6 Plot the results on a dot plot.arrow_forward2. A researcher measures the relationship between education (in years) and investment gains (in thousands of dollars). Answer the following questions based on the results provided. SP = 16.25.a. Create a scatter plot of the datab. Calculate r and r2c. Report results in APA style.d. What do results meanarrow_forward
- A. Using this data below, create an X-Y scatter plot using MS EXCEL Urea (mM, X-data) Fluorescnce Intensity, Y data) 5 229 11 218 24 204 52 154 106 85 190 12arrow_forwardGiven following data set generate dot plot number of text messages sent by 20 students in Mrs. T calculus class 1 3 2 13 32 8 2 6 3 4 1 0 2 2 0 2 1 2 7 2arrow_forwardA used car company believes that there is a relationship between the amount spent on advertising and its sales. Data collected for 6 years are as follow: Amount spent on advertising Sales ($thousands) ($millions) 2.0 1 3.0 3 2.5 4 2.0 2 2.0 1 3.5 7 1. Illustrate the above on a scatter plot.arrow_forward
- An electronics store sells new and used Z-phones. The store manager made the scatter plot below to show the selling prices of used Z-phones and their ages, in monthsIf these data are modeled by the line y=-10x+410, which best describes a valid prediction the manager could make, based on the dataA.If the store sells a Z-phone that is 30 months old, it will probably sell for only $50B.If the store sells a brand-new Z-phone, it can expect a customer to pay about $410C.For every one-month increase in phone age, the price a customer will pay increases by about $10D.For every one-year increase in phone age, the price a customer will pay decreases by about $10arrow_forwardA study is made of the relationship between annual production volume of Good A and factory floor area. Table below shows the data from a sample of 10 factories. Factory Factory floor area, X (‘000m2 ) Annual production volume, Y ($‘ 000) 1 40 3.5 2 600 25.0 3 60 4.8 4 72 3.5 5 400 30.0 6 90 5.0 7 200 12.0 8 70 4.5 9 80 5.0 10 84 6.0 Construct a scatter plot.arrow_forwardThe following table shows retail sales in drug stores in billions of dollars in the U.S. for years since 1995. Year03691215 Retail Sales85.851108.426141.781169.256202.297222.266 Let y be the retails sales in billions of dollars in x years since 1995. A linear model for the data is y=9.44x+84.182 A) Use the above scatter plot to decide whether the line of best fit, fits the data well. The function is a good model for the data.The function is not a good model for the data B) To the nearest billion, estimate the retails sales in the U. S. in 2011. billions of dollars. C) Use the equation to find the year in which retails sales will be $240 billion. .arrow_forward
 Glencoe Algebra 1, Student Edition, 9780079039897...AlgebraISBN:9780079039897Author:CarterPublisher:McGraw Hill
 Functions and Change: A Modeling Approach to Coll...AlgebraISBN:9781337111348Author:Bruce Crauder, Benny Evans, Alan NoellPublisher:Cengage Learning
 Algebra & Trigonometry with Analytic GeometryAlgebraISBN:9781133382119Author:SwokowskiPublisher:Cengage