Videos
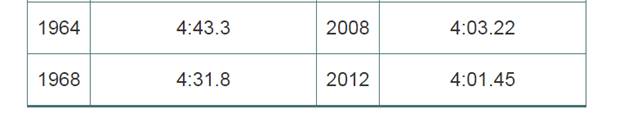
Table 15.3 shows women’s 400-meter freestyle Olympic winning times in recent history.
a. Make a graphical display of the data in Table 15.3.
b. Write at least four questions about your graph in part (a); include at least one at each of the three graph-reading levels. Label each question with its level. Answer your questions (to the extent that it is possible) and explain your answers briefly.
Table 15.3 Women’s 400-meter freestyle Olympic winningtimes.
Source: Qlympic.org, Official Website of the Olympic Movement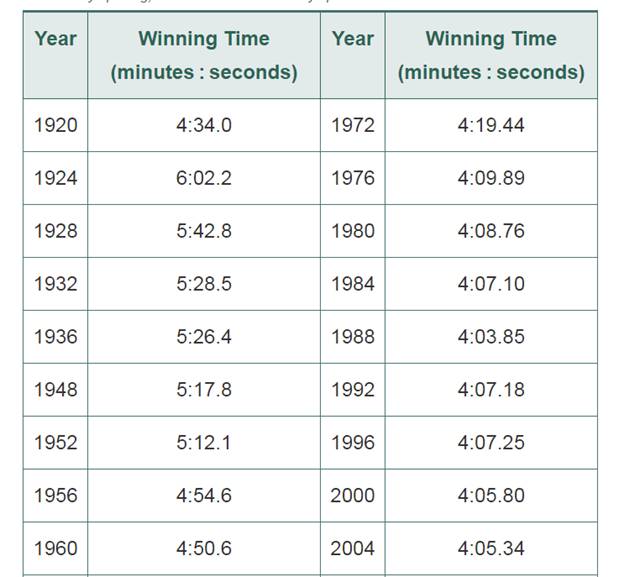
Want to see the full answer?
Check out a sample textbook solution
Chapter 15 Solutions
Mathematics for Elementary Teachers with Activities Plus MyLab Math -- Title-Specific Access Card Package (5th Edition)
Additional Math Textbook Solutions
MATH IN OUR WORLD (LOOSELEAF)-W/ACCESS
Mathematics All Around (6th Edition)
Differential Equations: An Introduction to Modern Methods and Applications
Discrete Mathematics and Its Applications ( 8th International Edition ) ISBN:9781260091991
A Survey of Mathematics with Applications (10th Edition) - Standalone book
Calculus for Business, Economics, Life Sciences, and Social Sciences (14th Edition)


 Glencoe Algebra 1, Student Edition, 9780079039897...AlgebraISBN:9780079039897Author:CarterPublisher:McGraw Hill
 Algebra: Structure And Method, Book 1AlgebraISBN:9780395977224Author:Richard G. Brown, Mary P. Dolciani, Robert H. Sorgenfrey, William L. ColePublisher:McDougal Littell
 College Algebra (MindTap Course List)AlgebraISBN:9781305652231Author:R. David Gustafson, Jeff HughesPublisher:Cengage Learning
 Algebra & Trigonometry with Analytic GeometryAlgebraISBN:9781133382119Author:SwokowskiPublisher:Cengage