Mathematics for Elementary Teachers with Activities Plus MyLab Math -- Title-Specific Access Card Package (5th Edition)
bartleby

Concept explainers

bartleby

Videos

Textbook Question
Book Icon
Chapter 15.4, Problem 3P

The three histograms in Figure 15.37 show the hypotheticalperformance of students in three different school districts on thesame test. A score below 40 on the test is considered failing. Ascore of 80 or above is considered excellent.
Chapter 15.4, Problem 3P, The three histograms in Figure 15.37 show the hypotheticalperformance of students in three different , example  1
Chapter 15.4, Problem 3P, The three histograms in Figure 15.37 show the hypotheticalperformance of students in three different , example  2
Chapter 15.4, Problem 3P, The three histograms in Figure 15.37 show the hypotheticalperformance of students in three different , example  3
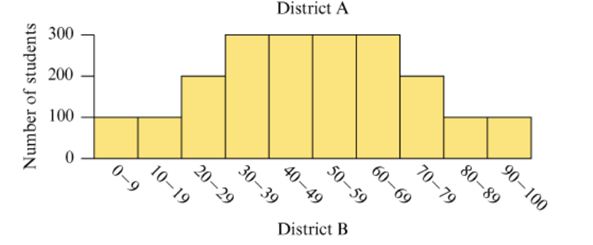
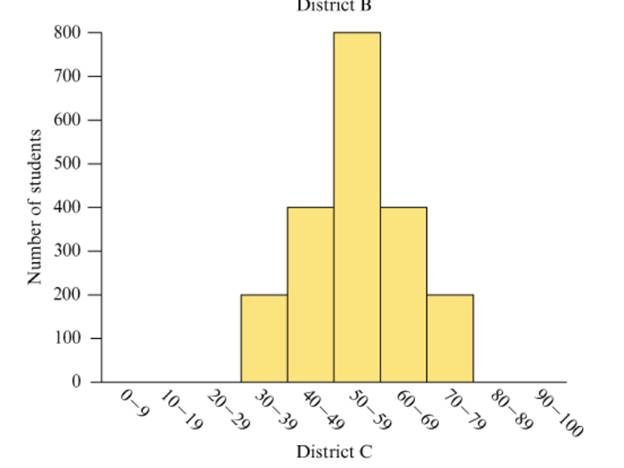
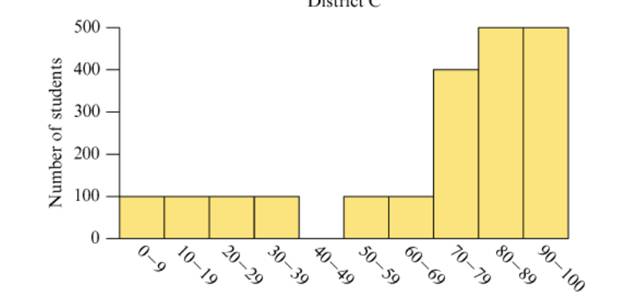
Figure 15.37 Performance of three hypothetical schooldistricts on a test.
a. Estimate the mean score on the test for each school district by viewing the mean as a balance point, as discussed in Section 15.3.
b. Discuss what information you can glean from the histograms that wouldn’t be apparent just from knowing the mean or median scores on the test.
c. Discuss how each school district could argue that it did better than at least one other school district.

Blurred answer

Chapter 15 Solutions

Mathematics for Elementary Teachers with Activities Plus MyLab Math -- Title-Specific Access Card Package (5th Edition)

Ch. 15.1 - The following problem is an example of the...Ch. 15.1 - A group studying violence wants to determine the...Ch. 15.2 - Three third-grade classes are having a contest to...Ch. 15.2 - Find 3 coins of any type (as long as all 3 have a...Ch. 15.2 - Table 15.3 shows women’s 400-meter freestyle...Ch. 15.2 - Using an Internet browser, go to census.gov, the...Ch. 15.2 - Using an Internet browser, go to the webpage of...Ch. 15.2 - Using an Internet browser, go to one of the...Ch. 15.2 - Using an Internet browser, go to one of the...Ch. 15.2 - a. Describe in detail an activity suitable for use...Ch. 15.3 - In your own words, explain why the following two...Ch. 15.3 - Explain why the mean of a list of numbers must...Ch. 15.3 - Explain why the mean of two numbers is exactly...Ch. 15.3 - Shante caught 17 ladybugs every day for 4 days....Ch. 15.3 - John’s average annual income over a 4-year period...Ch. 15.3 - Tracy’s times swimming 200 yards were as follows:...Ch. 15.3 - Explain how you can quickly calculate the mean of...Ch. 15.3 - Explain how you can quickly calculate the mean of...Ch. 15.3 - average on her first 3 math tests was 80. Her...Ch. 15.3 - A teacher gives a 10-point test to a class of 10...Ch. 15.3 - In your own words, describe how to view the mean...Ch. 15.3 - Discuss Jessica’s reasoning about calculating the...Ch. 15.3 - ]The dot plot in Figure 15.21 represents the...Ch. 15.3 - For each of the following situations, decide...Ch. 15.3 - A teacher gives a 10-point test to a class of 9...Ch. 15.3 - A teacher gives a 10-point test to a class of 9...Ch. 15.3 - In Ritzy County, the average annual household...Ch. 15.3 - In county A, the average score on the grade 5 Iowa...Ch. 15.3 - a. The histogram at the top of Figure 15.22 shows...Ch. 15.3 - * Ms. Smith needs to figure her students’ homework...Ch. 15.3 - The average speed of a moving object during a...Ch. 15.4 - What is the difference between scoring in the 90th...Ch. 15.4 - What is the purpose of reporting a student’s...Ch. 15.4 - The three histograms in Figure 15.37 show the...Ch. 15.4 - At a math center in a class, there is a bag filled...Ch. 15.4 - Refer to Figure 15.26 on page 706. a. Refer to the...Ch. 15.4 - Refer to Figure 15.26 on page 706. a. Refer to the...Ch. 15.4 - Refer to Figure 15.26 on page 706. a. Write at...Ch. 15.4 - Use the NAEP long-term trend data about...Ch. 15.4 - Determine the median and interquartile range for...Ch. 15.4 - a. Make a box plot for the data in Figure 15.38....Ch. 15.4 - Determine the medians and interquartile ranges for...Ch. 15.4 - a. Make box plots for the dot plots in Figure...Ch. 15.4 - A fifth-grade class is wondering ¡f girls’ names...Ch. 15.4 - Compute the mean and the MAD for each of the dot...Ch. 15.4 - On a state-wide test graded on a 10-point scale,...Ch. 15.4 - A 400-point test is given to a group of students....
Knowledge Booster
Background pattern image
Math
Learn more about
Need a deep-dive on the concept behind this application? Look no further. Learn more about this topic, subject and related others by exploring similar questions and additional content below.
Recommended textbooks for you
Text book image
Glencoe Algebra 1, Student Edition, 9780079039897...
Algebra
ISBN:9780079039897
Author:Carter
Publisher:McGraw Hill
The Shape of Data: Distributions: Crash Course Statistics #7; Author: CrashCourse;https://www.youtube.com/watch?v=bPFNxD3Yg6U;License: Standard YouTube License, CC-BY
Shape, Center, and Spread - Module 20.2 (Part 1); Author: Mrmathblog;https://www.youtube.com/watch?v=COaid7O_Gag;License: Standard YouTube License, CC-BY
Shape, Center and Spread; Author: Emily Murdock;https://www.youtube.com/watch?v=_YyW0DSCzpM;License: Standard Youtube License