
Mathematical Statistics with Applications
7th Edition
ISBN: 9781111798789
Author: Dennis O. Wackerly
Publisher: Cengage Learning
expand_more
expand_more
format_list_bulleted
Concept explainers
Videos
Textbook Question
Chapter 15.4, Problem 14E
Refer to Exercise 15.6(a). Answer the question by using the Wilcoxon signed-rank test.
15.6 On clear, cold nights in the central Florida citrus region, the precise location of below-freezing temperatures is important because the methods of protecting trees from freezing conditions are very expensive. One method of locating likely cold spots is by relating temperature to elevation. It is conjectured that on calm nights the cold spots will be at low elevations. The highest and lowest spots in a particular grove yielded the minimum temperatures listed in the accompanying table for ten cold nights in a recent winter.
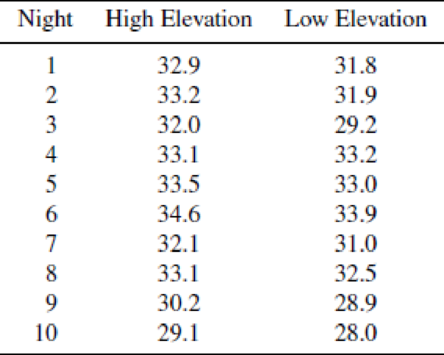
- a Is there sufficient evidence to support the conjecture that low elevations tend to be colder? (Use the sign test. Give the associated p-value.)
- b Would it be reasonable to use a t test on the data? Why or why not?
Expert Solution & Answer
Want to see the full answer?
Check out a sample textbook solution
Students have asked these similar questions
Refer to Exercise 8.S.6. Analyze these data using a Wilcoxon signed-rank test.
Note- bolded quiz have already answered
A possible important environmental determinant of lung function in children is the amount of cigarette smoking in the home. Suppose this question is studied by selecting two groups: Group 1 consists of 23 nonsmoking children 5-9 years of age, both of whose parents smoke, who have a mean forced expiratory volume (FEV) of 2.1 L and a standard deviation of 0.7 L; group 2 consists of 20 nonsmoking children of comparable age, neither of whose parents smoke, who have a mean FEV of 2.3 L and a standard deviation of 0.4 L.*8.31 What are the appropriate null and alternative hypotheses to compare the means of the two groups?
*8.32 What is the appropriate test procedure for the hypotheses in Problem 8.31?
*8.33 Carry out the test in Problem 8.32 using the criticalvalue method.
*8.34 Provide a 95% CI for the true mean difference in FEV between 5- to 9-year-old children whose parents smoke and comparable children whose parents do not smoke.
*8.35 Assuming…
A professor at the University of Iowa was interested in evaluating whether
domestic dispute calls were more dangerous to officers than other types of calls. Collecting information on call for service and whether the call resulted in officer injury. The data is displayed in the contingency table below
Using an alpha level of 0.05, are domestic calls more dangerous for officers than other types of calls?
Compute Cramer’s V and identify if it is a small, medium, or large effect
Chapter 15 Solutions
Mathematical Statistics with Applications
Ch. 15.3 - What significance levels between = .01 and = .15...Ch. 15.3 - Prob. 2ECh. 15.3 - Clinical data concerning the effectiveness of two...Ch. 15.3 - Prob. 4ECh. 15.3 - New food products are frequently subjected to...Ch. 15.3 - On clear, cold nights in the central Florida...Ch. 15.3 - A psychological experiment was conducted to...Ch. 15.3 - Refer to Exercise 12.15. Using the sign test, do...Ch. 15.3 - Prob. 9ECh. 15.4 - The accompanying table gives the scores of a group...
Ch. 15.4 - Refer to Exercise 15.4. What answers are obtained...Ch. 15.4 - Refer to Exercise 15.6(a). Answer the question by...Ch. 15.4 - Eight subjects were asked to perform a simple...Ch. 15.4 - Two methods, A and B, for controlling traffic were...Ch. 15.4 - Dental researchers have developed a new material...Ch. 15.4 - Refer to Exercise 12.16. With = .01, use the...Ch. 15.4 - Suppose that Y1, Y2,, Yn is a random sample from a...Ch. 15.4 - The spokesperson for an organization supporting...Ch. 15.6 - Find the p-values associated with each of the...Ch. 15.6 - In some tests of healthy, elderly men, a new drug...Ch. 15.6 - Two plastics, each produced by a different...Ch. 15.6 - Prob. 24ECh. 15.6 - Prob. 25ECh. 15.6 - Prob. 26ECh. 15.6 - Prob. 27ECh. 15.6 - Prob. 28ECh. 15.7 - The table that follows contains data on the leaf...Ch. 15.7 - Prob. 30ECh. 15.7 - Three different brands of magnetron tubes (the key...Ch. 15.7 - An experiment was conducted to compare the length...Ch. 15.7 - Prob. 33ECh. 15.7 - Prob. 34ECh. 15.7 - Prob. 35ECh. 15.8 - In a study of palatability of antibiotics for...Ch. 15.8 - Prob. 38ECh. 15.8 - Prob. 39ECh. 15.8 - A serious drought-related problem for farmers is...Ch. 15.8 - Prob. 41ECh. 15.8 - Prob. 42ECh. 15.8 - Prob. 43ECh. 15.8 - Prob. 44ECh. 15.8 - Prob. 45ECh. 15.9 - Prob. 46ECh. 15.9 - Prob. 47ECh. 15.9 - Prob. 48ECh. 15.9 - Prob. 49ECh. 15.9 - Prob. 50ECh. 15.9 - Prob. 52ECh. 15.10 - Prob. 53ECh. 15.10 - Prob. 54ECh. 15.10 - Prob. 55ECh. 15.10 - Prob. 56ECh. 15.10 - Prob. 57ECh. 15.10 - Prob. 58ECh. 15.10 - Refer to Exercise 11.4. Regard both book and...Ch. 15.10 - Prob. 60ECh. 15 - Prob. 62SECh. 15 - Prob. 63SECh. 15 - Prob. 64SECh. 15 - Prob. 65SECh. 15 - Prob. 67SECh. 15 - Prob. 69SECh. 15 - Prob. 70SECh. 15 - Prob. 71SECh. 15 - Prob. 72SECh. 15 - Prob. 74SECh. 15 - Prob. 75SECh. 15 - Prob. 76SECh. 15 - Prob. 77SECh. 15 - Prob. 78SE
Knowledge Booster


Learn more about
Need a deep-dive on the concept behind this application? Look no further. Learn more about this topic, statistics and related others by exploring similar questions and additional content below.Similar questions
- A paper investigated the driving behavior of teenagers by observing their vehicles as they left a high school parking lot and then again at a site approximately 1 2 mile from the school. Assume that it is reasonable to regard the teen drivers in this study as representative of the population of teen drivers. Amount by Which Speed Limit Was Exceeded MaleDriver FemaleDriver 1.3 -0.1 1.3 0.4 0.9 1.1 2.1 0.7 0.7 1.1 1.3 1.2 3 0.1 1.3 0.9 0.6 0.5 2.1 0.5 (a) Use a .01 level of significance for any hypothesis tests. Data consistent with summary quantities appearing in the paper are given in the table. The measurements represent the difference between the observed vehicle speed and the posted speed limit (in miles per hour) for a sample of male teenage drivers and a sample of female teenage drivers. (Use μmales − μfemales.Round your test statistic to two decimal places. Round your degrees of freedom down to the nearest whole number. Round your p-value to…arrow_forwardA paper investigated the driving behavior of teenagers by observing their vehicles as they left a high school parking lot and then again at a site approximately 1 2 mile from the school. Assume that it is reasonable to regard the teen drivers in this study as representative of the population of teen drivers. Amount by Which Speed Limit Was Exceeded MaleDriver FemaleDriver 1.2 -0.1 1.4 0.4 0.9 1.1 2.1 0.7 0.7 1.1 1.3 1.2 3 0.1 1.3 0.9 0.6 0.5 2.1 0.5 (a) Use a .01 level of significance for any hypothesis tests. Data consistent with summary quantities appearing in the paper are given in the table. The measurements represent the difference between the observed vehicle speed and the posted speed limit (in miles per hour) for a sample of male teenage drivers and a sample of female teenage drivers. (Use μmales − μfemales.Round your test statistic to two decimal places. Round your degrees of freedom down to the nearest whole number. Round your p-value to…arrow_forwardThe article “Effect of Varying Solids Concentration and Organic Loading on the Performance of Temperature Phased Anaerobic Digestion Process” (S. Vandenburgh and T. Ellis, Water Environment Research, 2002:142–148) discusses experiments to determine the effect of the solids concentration on the performance of treatment methods for wastewater sludge. In the first experiment, the concentration of solids (in g/L) was 43.94 ± 1.18. In the second experiment, which was independent of the first, the concentration was 48.66 ± 1.76. Estimate the difference in the concentration between the two experiments, and find the uncertainty in the estimate.arrow_forward
- If the value of Cronbach’s alpha is 0.07, it means ___________; a. Research instrument is not reliable b. Research instrument is internally consistent c. Data is reliable d. Data is internally consistentarrow_forwardA researcher is interested in testing the relationship between smoking and BMI (kg/m2) in adults aged 30-45. In order to test this association, the researcher divides smoking into currently more than a pack a day, currently less than a pack a day, and never smokers. The following table represents the BMIs for each participant enrolled by their respective smoking category. Current Smoker (≥1pack/day) Current Smoker (<1 pack/day Never Smoked 26.7 29.4 22.1 29.4 28.6 30.4 24.3 27.4 21.3 28.4 23.2 26.4 21.6 20.1 19.7 27.4 20.6 19.8 26.8 19.7 21.6 36.4 19.6 22.3 31.5 21.6 24.3 27.4 21.5 *Continue as though all assumptions for ANOVA are met. A) Calculate the MSW and MSB for the data represented above. B) Carry out a formal test for a one-way analysis of variance among the groups and interpret your results.arrow_forwardA Chi square test has been conducted to assess the relationship between marital status and church attendance. The obtained Chi square is 7.45 and the critical Chi square is 9.488. What may be concluded? Group of answer choices A.reject the null hypothesis, church attendance and marital status are independent B.fail to reject the null hypothesis, church attendance and marital status are independent C.Reject the null hypothesis, church attendance and marital status are dependent D.fail to reject the null hypothesis, church attendance and marital status are dependentarrow_forward
- A travel association says the daily lodging costs for a family in the United States is $132. You work for a tourist publication and want to test this claim. You randomly selected 10 U.S. families and find out how much each spent on lodging for one overnight trip. At alpha=0.02, can you reject the travel association's claim? (Adapted from the American Automobile Association) 164 137 142 155 119 104 74 204 148 181 Assume the population is normally distributed.arrow_forwardThe researchers reported:" A 2x2 ANOVA revealed, first of all, a main effect for depletion, indicating that depleted individuals generated less ideas (M = 9.40, SD = 5.64) than non-depleted individuals (M = 12.44, SD = 7.34), F (1, 108) = 6.03, p = .016, n2 = .05. This effect was qualified by the expected interaction with [perseverance], F (1,108) = 4.52, p = .036, n2 = .05". What size are the effects for the main effect of depletion and for the interaction between depletion and perseverance, according to Cohen's conventions? a. These are small- to -medium effects b. These are non existent effects c. These are large effects d. We are unable to tell from from the n2 / r2 statisticsarrow_forwardAccording to the February 2008 Federal Trade Commission report on consumer fraud and identity theft, 23% of all complaints in 2007 were for identity theft. In that year, assume some state had 544 complaints of identity theft out of 1950 consumer complaints. Do these data provide enough evidence to show that that state had a higher proportion of identity theft than 23%? Test at the 9% level.P: PARAMETER What is the correct parameter symbol for this problem? What is the wording of the parameter in the context of this problem? H: HYPOTHESES Fill in the correct null and alternative hypotheses: H0:H0: HA:HA: A: ASSUMPTIONS Since information was collected from each object, what conditions do we need to check? Check all that apply. n(1−pˆ)≥10n(1-p̂)≥10 n≥30n≥30 or normal population. σσ is unknown. σσ is known. n(1−p)≥10n(1-p)≥10 np≥10np≥10 N≥20nN≥20n n(pˆ)≥10n(p̂)≥10 Check…arrow_forward
- According to the February 2008 Federal Trade Commission report on consumer fraud and identity theft, 23% of all complaints in 2007 were for identity theft. In that year, assume some state had 534 complaints of identity theft out of 1960 consumer complaints. Do these data provide enough evidence to show that that state had a higher proportion of identity theft than 23%? Test at the 6% level.P: PARAMETER What is the correct parameter symbol for this problem? What is the wording of the parameter in the context of this problem? H: HYPOTHESES Fill in the correct null and alternative hypotheses: ASSUMPTIONS Since information was collected from each object, what conditions do we need to check? Check all that apply. np≥10np≥10 n≥30n≥30 or normal population. σσ is known. σσ is unknown. N≥20nN≥20n n(1−p)≥10arrow_forward(1) Conduct a hypothesis test, at the 5% level of significance, to determine whether ? is significant (2) What would be the growth of the plant if 4g of fertilizer and 7g of ater was given to it daily? (3) Carry out an F -test at the 1% significance level to determine whether the model is significantarrow_forwardIn a study attempting to replicate findings by Stephens, Atkins, & Kingston (2009), each participant was asked to plunge a hand into the icy water and keep it there as long as the pain would allow. In one condition, the participants repeated their favorite curse words while their hands were in the water. In the other condition, they repeated neutral words. The original research showed that, in addition to lowering the participants’ perception of pain, swearing also increased the amount of time they were able to tolerate the pain. Data similar to the results obtained in the study are shown in the following table: _____________Amount of Time (in Seconds)_ Participant Swear Words Neutral Words 1 94 59 2 70 61 3 52 47 4…arrow_forward
arrow_back_ios
SEE MORE QUESTIONS
arrow_forward_ios
Recommended textbooks for you
 MATLAB: An Introduction with ApplicationsStatisticsISBN:9781119256830Author:Amos GilatPublisher:John Wiley & Sons Inc
 Probability and Statistics for Engineering and th...StatisticsISBN:9781305251809Author:Jay L. DevorePublisher:Cengage Learning
 Statistics for The Behavioral Sciences (MindTap C...StatisticsISBN:9781305504912Author:Frederick J Gravetter, Larry B. WallnauPublisher:Cengage Learning
 Elementary Statistics: Picturing the World (7th E...StatisticsISBN:9780134683416Author:Ron Larson, Betsy FarberPublisher:PEARSON
 The Basic Practice of StatisticsStatisticsISBN:9781319042578Author:David S. Moore, William I. Notz, Michael A. FlignerPublisher:W. H. Freeman
 Introduction to the Practice of StatisticsStatisticsISBN:9781319013387Author:David S. Moore, George P. McCabe, Bruce A. CraigPublisher:W. H. Freeman
MATLAB: An Introduction with Applications
Statistics
ISBN:9781119256830
Author:Amos Gilat
Publisher:John Wiley & Sons Inc
Probability and Statistics for Engineering and th...
Statistics
ISBN:9781305251809
Author:Jay L. Devore
Publisher:Cengage Learning
Statistics for The Behavioral Sciences (MindTap C...
Statistics
ISBN:9781305504912
Author:Frederick J Gravetter, Larry B. Wallnau
Publisher:Cengage Learning
Elementary Statistics: Picturing the World (7th E...
Statistics
ISBN:9780134683416
Author:Ron Larson, Betsy Farber
Publisher:PEARSON
The Basic Practice of Statistics
Statistics
ISBN:9781319042578
Author:David S. Moore, William I. Notz, Michael A. Fligner
Publisher:W. H. Freeman
Introduction to the Practice of Statistics
Statistics
ISBN:9781319013387
Author:David S. Moore, George P. McCabe, Bruce A. Craig
Publisher:W. H. Freeman
Statistics 4.1 Point Estimators; Author: Dr. Jack L. Jackson II;https://www.youtube.com/watch?v=2MrI0J8XCEE;License: Standard YouTube License, CC-BY
Statistics 101: Point Estimators; Author: Brandon Foltz;https://www.youtube.com/watch?v=4v41z3HwLaM;License: Standard YouTube License, CC-BY
Central limit theorem; Author: 365 Data Science;https://www.youtube.com/watch?v=b5xQmk9veZ4;License: Standard YouTube License, CC-BY
Point Estimate Definition & Example; Author: Prof. Essa;https://www.youtube.com/watch?v=OTVwtvQmSn0;License: Standard Youtube License
Point Estimation; Author: Vamsidhar Ambatipudi;https://www.youtube.com/watch?v=flqhlM2bZWc;License: Standard Youtube License