
Concept explainers
Videos
Refer to Exercise 12.16. With α = .01, use the Wilcoxon signed-rank test to see if there was a significant loss in muck depth between the beginning and end of the study.
12.16 “Muck” is the rich, highly organic type of soil that serves as the primary growth medium for vegetation in the Florida Everglades. Because of the high concentration of organic material, muck can be destroyed over time by a variety of natural and human-made causes. Members of the Florida Game and Fresh Water Fish Commission staked out several plots in the Everglades. The depth of muck at each location was measured when each plot was marked and again 6 years later. The following table identifies a portion of the data (given in inches) obtained.
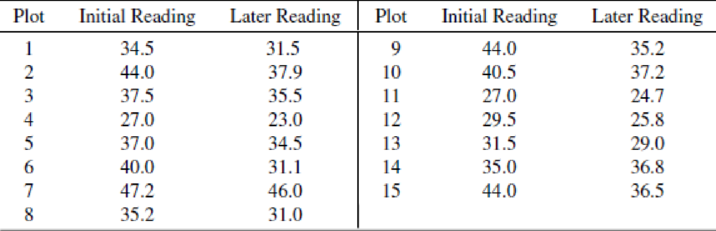
- a Test to see if there is sufficient evidence to indicate a decrease in average muck depth during the study period. Give bounds on the associated p-value. What would you conclude if you desired to implement an α = .01 level test? (Although you are free to take the necessary differences in any order that you prefer, the answer provided at the back of the book assumes that the differences were formed by taking later readings minus initial readings.)
- b Give a 95% confidence interval for the difference in mean muck depths at the end and beginning of the study. Interpret this interval. [See the remark following part (a).]
- c Give a 95% confidence interval for the initial mean muck depth in the portion of the Everglades in which the study was conducted.
- d Repeat the instructions of part (c) for later readings.
- e What assumptions are necessary to apply the techniques you used in answering parts (a) and (b)? Parts (c) and (d)?
Want to see the full answer?
Check out a sample textbook solution
Chapter 15 Solutions
Mathematical Statistics with Applications


- The article “Withdrawal Strength of Threaded Nails” (D. Rammer, S. Winistorfer, and D. Bender, Journal of Structural Engineering 2001:442–449) describes an experiment comparing the ultimate withdrawal strengths (in N/mm) for several types of nails. For an annularly threaded nail with shank diameter 3.76 mm driven into spruce-pine-fir lumber, the ultimate withdrawal strength was modeled as lognormal with μ = 3.82 and σ = 0.219. For a helically threaded nail under the same conditions, the strength was modeled as lognormal with μ = 3.47 and σ = 0.272. a) What is the mean withdrawal strength for annularly threaded nails? b) What is the mean withdrawal strength for helically threaded nails? c) For which type of nail is it more probable that the withdrawal strength will be greater than 50 N/mm? d) What is the probability that a helically threaded nail will have a greater withdrawal strength than the median for annularly threaded nails? e) An experiment is performed in which withdrawal…arrow_forward1)A new starch polymer foam with high shock absorbent properties is expected to perform better thanthe old foam which can withstand a maximum impact of 1.56 Joule (J). A simple destructive testto quantify shock absorption ability of the new foam is conducted. Table 5 shows the impact energyabsorbed (in J) that the new foam can withstand for each test. Table 51.61 1.5 1.65 1.7 1.4 1.59 1.65 1.5 Does the recorded data suggests that the new foam performs better than the old foam? Use 2.5%level of significance. 2) A number of 28 university students who smokes completed a questionnaire inquiring their smokinghistory and behavior. The result shows that the average smoking initiation age of this group is 21.6years with a variance of 18.49. Based on past record, the smoking initiation age of universitystudent has a mean of 20.74 years with a standard deviation of 5.1 years. Conduct a necessaryanalysis to determine if the smoking initiation age remain the same as the previous record.…arrow_forwardStock y has a beta of 1.2 and an expected return of 11.5. Stock z has a beta of .80 and an expected return of 8.5 percentarrow_forward
- In terms of the model parameters, state the null hypothesis that, after controlling for sales and roe, ros has no effect on CEO salary. State the alternative that better stock market performance increases a CEO’s salary.arrow_forwardNote- bolded quiz have already answered A possible important environmental determinant of lung function in children is the amount of cigarette smoking in the home. Suppose this question is studied by selecting two groups: Group 1 consists of 23 nonsmoking children 5-9 years of age, both of whose parents smoke, who have a mean forced expiratory volume (FEV) of 2.1 L and a standard deviation of 0.7 L; group 2 consists of 20 nonsmoking children of comparable age, neither of whose parents smoke, who have a mean FEV of 2.3 L and a standard deviation of 0.4 L.*8.31 What are the appropriate null and alternative hypotheses to compare the means of the two groups? *8.32 What is the appropriate test procedure for the hypotheses in Problem 8.31? *8.33 Carry out the test in Problem 8.32 using the criticalvalue method. *8.34 Provide a 95% CI for the true mean difference in FEV between 5- to 9-year-old children whose parents smoke and comparable children whose parents do not smoke. *8.35 Assuming…arrow_forwardA research center claims that at least 22 % of adults in a certain country think that their taxes will be audited. In a random sample of 1000 adults in that country in a recent year, 19 % say they are concerned that their taxes will be audited. At alpha equals0.10 , is there enough evidence to reject the center's claim? Complete parts (a) through (e) below.arrow_forward
- If X1, X2, ... , Xn constitute a random sample of size n from an exponential population, show that X is a consis-tent estimator of the parameter θ.arrow_forwardAssume that as a portfolio manager the beta of your portfolio is 1.15 and that your performance is exactly on target with the SML data under condition 1. If the true SML data is given by condition 2, how much does your performance differ from the true SML? (1) RFR = 0.0625 Rm(proxy) = 0.12 (2) RK = 0.078 Rm(true) = 0.10arrow_forwardThe article in the ASCE Journal of Energy Engineering (1999, Vol. 125, pp.59-75) describes a study of the thermal inertia properties of autoclaved aerated concrete used as a building material. Five samples of the material were tested in a structure, and the average interior temperatures (°C) reported were as follows: 23.01, 22.22, 22.04, 22.62, and 22.59. Test that the average interior temperature is equal to 22.5°C using alpha (a) = 0.05. This problem is a test on what population parameter? What is the null and alternative hypothesis? What are the Significance level and type of test? What standardized test statistic will be used? What is the standard test statistic? What is the Statistical Decision? What is the statistical decision in the statement form?arrow_forward
- A study was conducted to assess the impact of nutrient enrichment on zooplankton densities in A & B Islands. An ecologist sampled populations of zooplankton in these two locations and observed the nutrient enrichment level was higher in A island when compared with the level in B island. It is predicted the zooplankton densities in A island will be greater than those found in B island.arrow_forwardFor some genetic mutations, it is thought that the frequency of the mutant gene in men increases linearly with age. If m1 is the frequency at age t1, and m2 is the frequency at age t2, then the yearly rate of increase is estimated by r = (m2 − m1)/(t2 − t1). In a polymerase chain reaction assay, the frequency in 20-year-old men was estimated to be 17.7 ± 1.7 per μgDNA, and the frequency in 40-year-old men was estimated to be 35.9 ± 5.8 per μg DNA. Assume that age is measured with negligible uncertainty.a) Estimate the yearly rate of increase, and find the uncertainty in the estimate.b) Find the relative uncertainty in the estimated rate of increase.arrow_forwardDepartment secretary has found the average number of complaints per week over the past few years is 1.4. However after a change in major requirements, the complaints over last 8 weeks averaged M = 3.0, with SS = 16. Has there been a significant increase in the number of student complaints over the past 8 weeks? What kind of t-test?______________ Test using alpha = .05 and write an APA style conclusion. 1) H0: H1: 2) Critical value: one or two-tailed? df= __ alpha = .05 __________ 3) Calculations: SS given so start w/ variance s2 SM t = M –µ SM 4) Is there a difference? Reject the Null? Write a sentence with APA stats.arrow_forward
 MATLAB: An Introduction with ApplicationsStatisticsISBN:9781119256830Author:Amos GilatPublisher:John Wiley & Sons Inc
 Probability and Statistics for Engineering and th...StatisticsISBN:9781305251809Author:Jay L. DevorePublisher:Cengage Learning
 Statistics for The Behavioral Sciences (MindTap C...StatisticsISBN:9781305504912Author:Frederick J Gravetter, Larry B. WallnauPublisher:Cengage Learning
 Elementary Statistics: Picturing the World (7th E...StatisticsISBN:9780134683416Author:Ron Larson, Betsy FarberPublisher:PEARSON
 The Basic Practice of StatisticsStatisticsISBN:9781319042578Author:David S. Moore, William I. Notz, Michael A. FlignerPublisher:W. H. Freeman
 Introduction to the Practice of StatisticsStatisticsISBN:9781319013387Author:David S. Moore, George P. McCabe, Bruce A. CraigPublisher:W. H. Freeman