
Modern Business Statistics with Microsoft Office Excel (with XLSTAT Education Edition Printed Access Card) (MindTap Course List)
6th Edition
ISBN: 9781337115186
Author: David R. Anderson, Dennis J. Sweeney, Thomas A. Williams, Jeffrey D. Camm, James J. Cochran
Publisher: Cengage Learning
expand_more
expand_more
format_list_bulleted
Concept explainers
Videos
Textbook Question
Chapter 15.5, Problem 24E
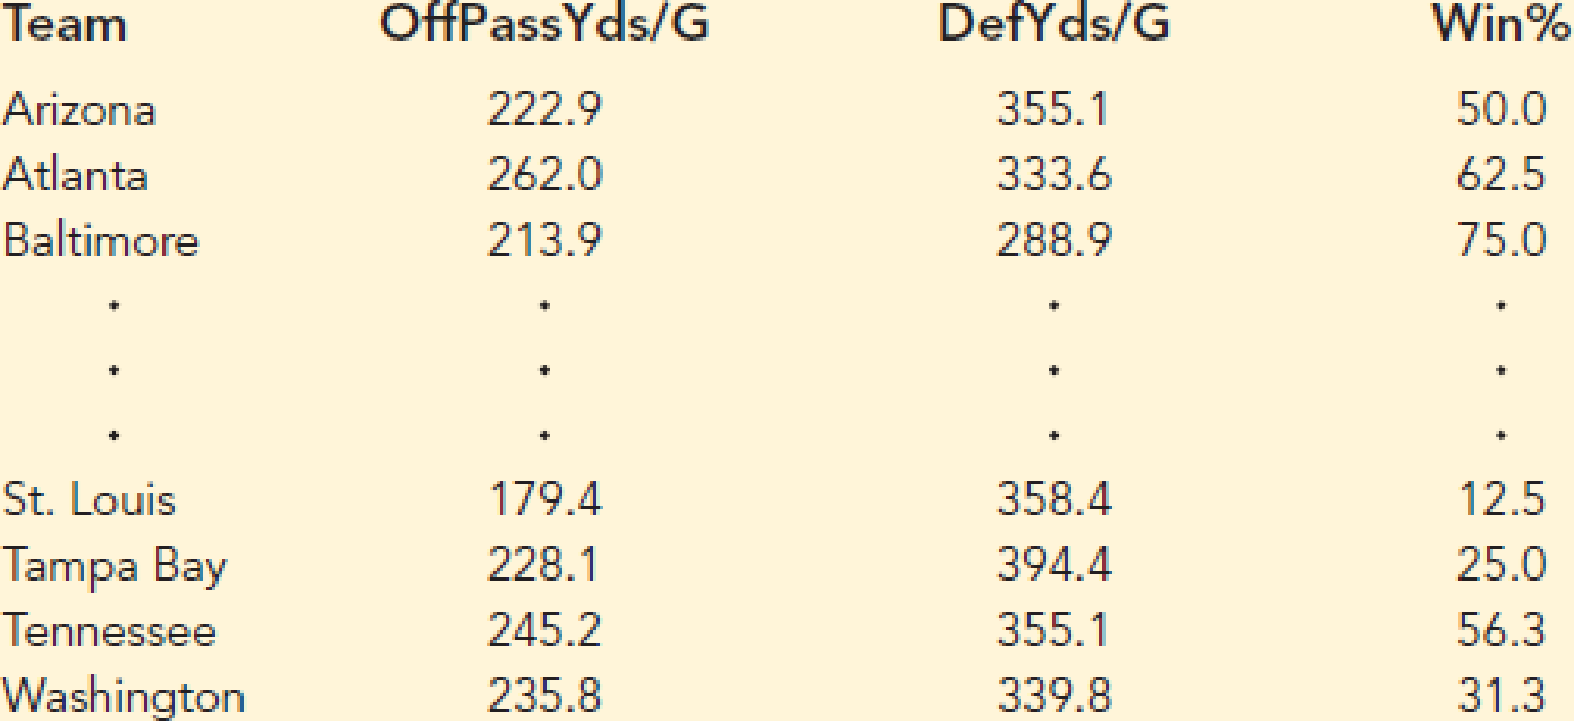
Testing Significance in Predicting NFL Wins. The National Football League (NFL) records a variety of performance data for individuals and teams. A portion of the data showing the average number of passing yards obtained per game on offense (OffPassYds/G), the average number of yards given up per game on defense (DefYds/G), and the percentage of games won (Win%), for one full season follows.
- a. Develop an estimated regression equation that can be used to predict the percentage of games won given the average number of passing yards obtained per game on offense and the average number of yards given up per game on defense.
- b. Use the F test to determine the overall significance of the relationship. What is your conclusion at the .05 level of significance?
- c. Use the t test to determine the significance of each independent variable. What is your conclusion at the .05 level of significance?
Expert Solution & Answer

Trending nowThis is a popular solution!

Chapter 15 Solutions
Modern Business Statistics with Microsoft Office Excel (with XLSTAT Education Edition Printed Access Card) (MindTap Course List)
Ch. 15.2 - 1. The estimated regression equation for a model...Ch. 15.2 - Consider the following data for a dependent...Ch. 15.2 - Prob. 3ECh. 15.2 - 4. A shoe store developed the following estimated...Ch. 15.2 - The owner of Showtime Movie Theaters, Inc. would...Ch. 15.2 - NFL Winning Percentage. The National Football...Ch. 15.2 - Prob. 7ECh. 15.2 - Scoring Cruise Ships. The Condé Nast Traveler Gold...Ch. 15.2 - The Professional Golfers Association (PGA)...Ch. 15.2 - Baseball Pitcher Performance. Major League...
Ch. 15.3 - 11. In exercise 1, the following estimated...Ch. 15.3 - 12. In exercise 2, 10 observations were provided...Ch. 15.3 - Prob. 13ECh. 15.3 - Prob. 14ECh. 15.3 - 15. In exercise 5, the owner of Showtime Movie...Ch. 15.3 - Prob. 16ECh. 15.3 - In part (d) of exercise 9, data contained in the...Ch. 15.3 - Prob. 18ECh. 15.5 - In exercise 1, the following estimated regression...Ch. 15.5 - Prob. 20ECh. 15.5 - Prob. 21ECh. 15.5 - Prob. 22ECh. 15.5 - Testing Significance in Theater Revenue. Refer to...Ch. 15.5 - Testing Significance in Predicting NFL Wins. The...Ch. 15.5 - The Condé Nast Traveler Gold List provides ratings...Ch. 15.5 - Prob. 26ECh. 15.6 - Prob. 27ECh. 15.7 - 32. Consider a regression study involving a...Ch. 15.7 - Prob. 33ECh. 15.7 - 34. Management proposed the following regression...Ch. 15.7 - Repair Time. Refer to the Johnson Filtration...Ch. 15.7 - Prob. 36ECh. 15.7 - Prob. 37ECh. 15.8 - Prob. 40ECh. 15.8 - Exercise 5 gave the following data on weekly gross...Ch. 15.8 - The following table reports the price, horsepower,...Ch. 15 - 49. The admissions officer for Clearwater College...Ch. 15 - The personnel director for Electronics Associates...Ch. 15 - Prob. 46SECh. 15 - Recall that in exercise 44, the admissions officer...Ch. 15 - Recall that in exercise 45 the personnel director...Ch. 15 - Fortune magazine publishes an annual list of the...Ch. 15 - The Department of Energy and the U.S....Ch. 15 - The Tire Rack, an online distributor of tires and...Ch. 15 - The National Basketball Association (NBA) records...Ch. 15 - Consumer Research, Inc., is an independent agency...Ch. 15 - Matt Kenseth won the 2012 Daytona 500, the most...Ch. 15 - When trying to decide what car to buy, real value...
Knowledge Booster


Learn more about
Need a deep-dive on the concept behind this application? Look no further. Learn more about this topic, statistics and related others by exploring similar questions and additional content below.Similar questions
- Life Expectancy The following table shows the average life expectancy, in years, of a child born in the given year42 Life expectancy 2005 77.6 2007 78.1 2009 78.5 2011 78.7 2013 78.8 a. Find the equation of the regression line, and explain the meaning of its slope. b. Plot the data points and the regression line. c. Explain in practical terms the meaning of the slope of the regression line. d. Based on the trend of the regression line, what do you predict as the life expectancy of a child born in 2019? e. Based on the trend of the regression line, what do you predict as the life expectancy of a child born in 1580?2300arrow_forwardXYZ Corporation Stock Prices The following table shows the average stock price, in dollars, of XYZ Corporation in the given month. Month Stock price January 2011 43.71 February 2011 44.22 March 2011 44.44 April 2011 45.17 May 2011 45.97 a. Find the equation of the regression line. Round the regression coefficients to three decimal places. b. Plot the data points and the regression line. c. Explain in practical terms the meaning of the slope of the regression line. d. Based on the trend of the regression line, what do you predict the stock price to be in January 2012? January 2013?arrow_forwardNoise and Intelligibility Audiologists study the intelligibility of spoken sentences under different noise levels. Intelligibility, the MRT score, is measured as the percent of a spoken sentence that the listener can decipher at a cesl4ain noise level in decibels (dB). The table shows the results of one such test. (a) Make a scatter plot of the data. (b) Find and graph the regression line. (c) Find the correlation coefficient. Is a linear model appropriate? (d) Use the linear model in put (b) to estimate the intelligibility of a sentence at a 94-dB noise level.arrow_forward
arrow_back_ios
arrow_forward_ios
Recommended textbooks for you
 Algebra and Trigonometry (MindTap Course List)AlgebraISBN:9781305071742Author:James Stewart, Lothar Redlin, Saleem WatsonPublisher:Cengage Learning
 Functions and Change: A Modeling Approach to Coll...AlgebraISBN:9781337111348Author:Bruce Crauder, Benny Evans, Alan NoellPublisher:Cengage Learning
 College AlgebraAlgebraISBN:9781305115545Author:James Stewart, Lothar Redlin, Saleem WatsonPublisher:Cengage Learning
 Glencoe Algebra 1, Student Edition, 9780079039897...AlgebraISBN:9780079039897Author:CarterPublisher:McGraw Hill
Algebra and Trigonometry (MindTap Course List)
Algebra
ISBN:9781305071742
Author:James Stewart, Lothar Redlin, Saleem Watson
Publisher:Cengage Learning
Functions and Change: A Modeling Approach to Coll...
Algebra
ISBN:9781337111348
Author:Bruce Crauder, Benny Evans, Alan Noell
Publisher:Cengage Learning
College Algebra
Algebra
ISBN:9781305115545
Author:James Stewart, Lothar Redlin, Saleem Watson
Publisher:Cengage Learning
Glencoe Algebra 1, Student Edition, 9780079039897...
Algebra
ISBN:9780079039897
Author:Carter
Publisher:McGraw Hill
The Shape of Data: Distributions: Crash Course Statistics #7; Author: CrashCourse;https://www.youtube.com/watch?v=bPFNxD3Yg6U;License: Standard YouTube License, CC-BY
Shape, Center, and Spread - Module 20.2 (Part 1); Author: Mrmathblog;https://www.youtube.com/watch?v=COaid7O_Gag;License: Standard YouTube License, CC-BY
Shape, Center and Spread; Author: Emily Murdock;https://www.youtube.com/watch?v=_YyW0DSCzpM;License: Standard Youtube License