
Concept explainers
Videos
The Professional Golfers Association (PGA) maintains data on performance and earnings for members of the PGA Tour. For the 2012 season Bubba Watson led all players in total driving distance, with an average of 309.2 yards per drive. Some of the factors thought to influence driving distance are club head speed, ball speed, and launch angle. For the 2012 season Bubba Watson had an average club head speed of 124.69 miles per hour, an average ball speed of 184.98 miles per hour, and an average launch angle of 8.79 degrees. The DATAfile named PGADrivingDist contains data on total driving distance and the factors related to driving distance for 190 members of the PGA Tour (PGA Tour website, November 1, 2012). Descriptions for the variables in the data set follow.
Club Head Speed: Speed at which the club impacts the ball (mph).
Ball Speed: Peak speed of the golf ball at launch (mph).
Launch Angle: Vertical launch angle of the ball immediately after leaving the club (degrees).
Total Distance: The average number of yards per drive.
- a. Develop an estimated regression equation that can be used to predict the average number of yards per drive given the club head speed.
- b. Develop an estimated regression equation that can be used to predict the average number of yards per drive given the ball speed.
- c. A recommendation has been made to develop an estimated regression equation that uses both club head speed and ball speed to predict the average number of yards per drive. Do you agree with this? Explain.
- d. Develop an estimated regression equation that can be used to predict the average number of yards per drive given the ball speed and the launch angle.
- e. Suppose a new member of the PGA Tour for 2013 has a ball speed of 170 miles per hour and a launch angle of 11 degrees. Use the estimated regression equation in part (d) to predict the average number of yards per drive for this player.
a.
Find the estimated regression equation that could be used to predict the average number of yards per drive given the club head speed.
Answer to Problem 9E
The estimated regression equation that could be used to predict the average number of yards per drive given the club head speed is
Explanation of Solution
Calculation:
The Professional Golfers Association (PGA) data consist of information regarding to the speed at which the club impacts the ball (club head speed), peak speed of the golf ball at launch (ball speed), vertical launch angle of the ball immediately after leaving the club (launch angle), and the average number of yards per drive (total distance).
Multiple linear regression model:
A multiple linear regression model is given as
Denote y as the dependent variable total distance.
Regression:
Software procedure:
Step-by-step procedure to get regression equation using EXCEL software:
- Open the file PGADrivingDist.
- Select Data > Data Analysis > Regression.
- Click OK.
- Under Input Y Range enter $E$1:$E$191.
- Under Input X Range enter $B$1:$B$191.
- Click the box of Labels.
- Under Output Range enter $H$1.
- Click OK.
Output obtained using EXCEL software is given as follows:
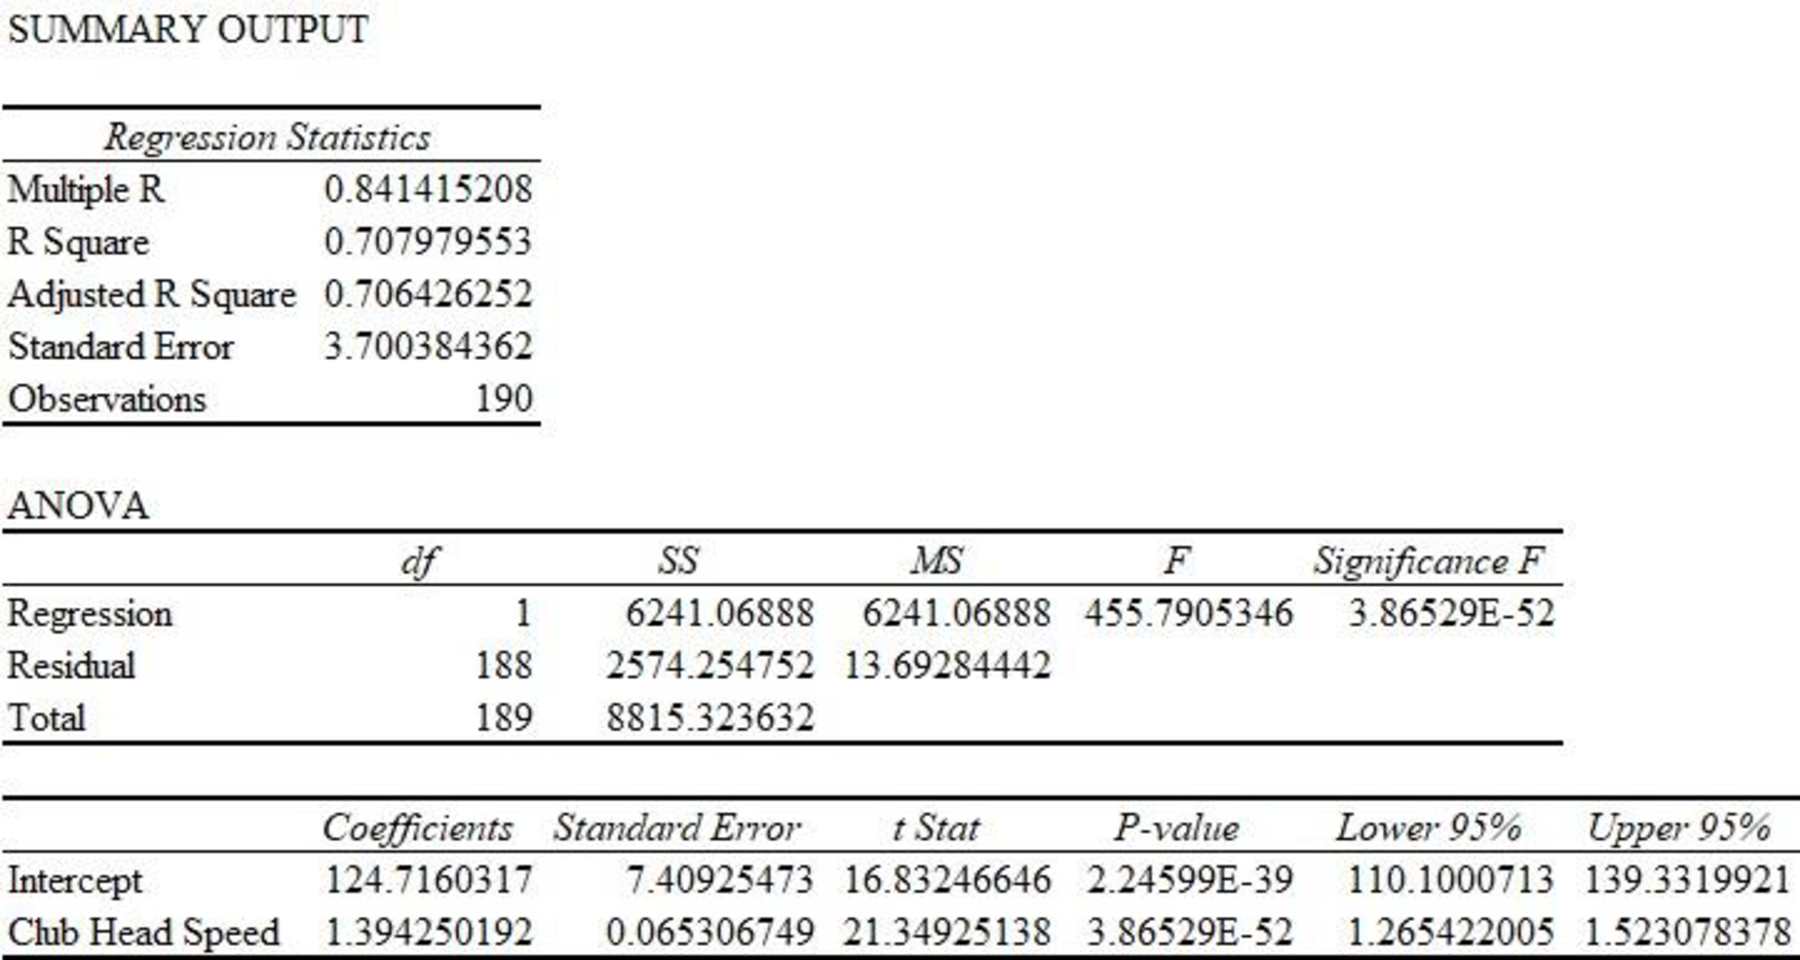
Thus, the estimated regression equation that could be used to predict the average number of yards per drive given the club head speed is
b.
Find the estimated regression equation that could be used to predict the average number of yards per drive given the ball speed.
Answer to Problem 9E
The estimated regression equation that could be used to predict the average number of yards per drive given the ball speed is
Explanation of Solution
Calculation:
The regression equation can be obtained using excel software.
Regression:
Software procedure:
Step-by-step procedure to get the regression equation using EXCEL software:
- Open the file PGADrivingDist.
- Select Data > Data Analysis > Regression.
- Click OK.
- Under Input Y Range enter $E$1:$E$191.
- Under Input X Range enter $C$1:$C$191.
- Click the box of Labels.
- Under Output Range enter $H$24.
- Click OK.
Output obtained using EXCEL software is given as follows:
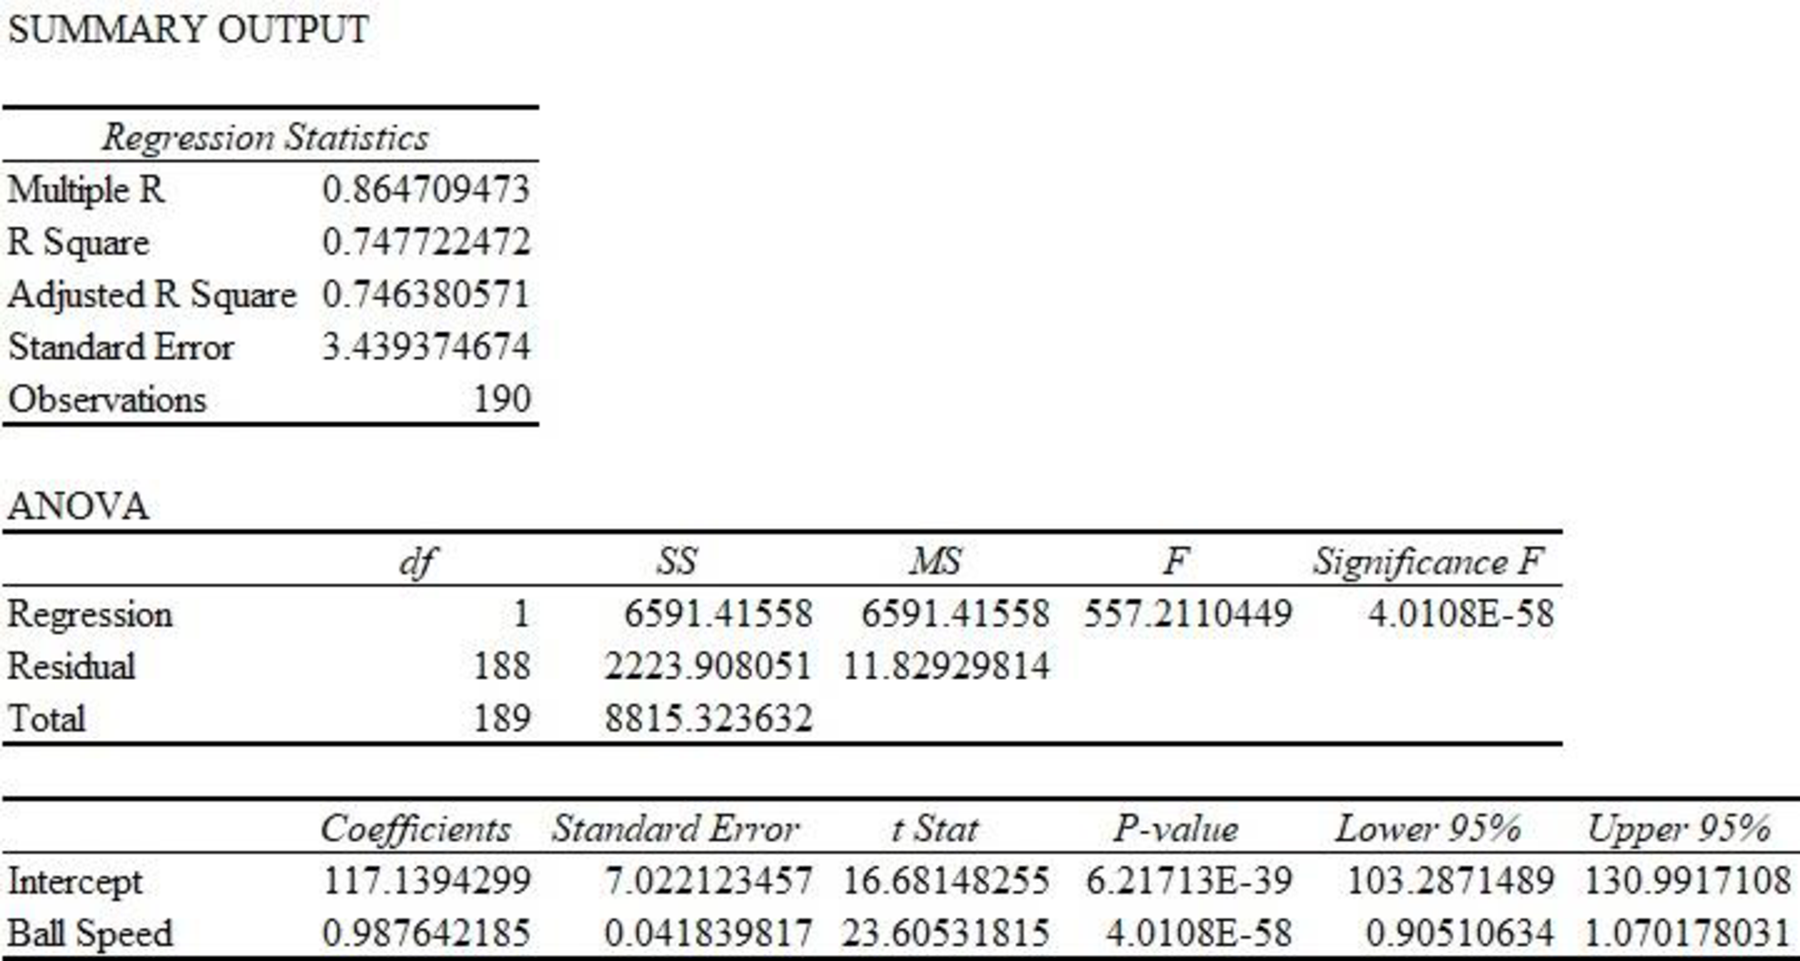
Thus, the estimated regression equation that could be used to predict the average number of yards per drive given the ball speed is
c.
Explain whether developing an estimated regression equation that uses both club head speed and ball speed to predict the average number of yards per drive is useful or not.
Explanation of Solution
Calculation:
Regression:
Software procedure:
Step-by-step procedure to get the regression equation using EXCEL software:
- Open the file PGADrivingDist.
- Select Data > Data Analysis > Regression.
- Click OK.
- Under Input Y Range enter $E$1:$E$191.
- Under Input X Range enter $B$1:$C$191.
- Click the box of Labels.
- Under Output Range enter $H$24.
- Click OK.
Output obtained using EXCEL software is given as follows:
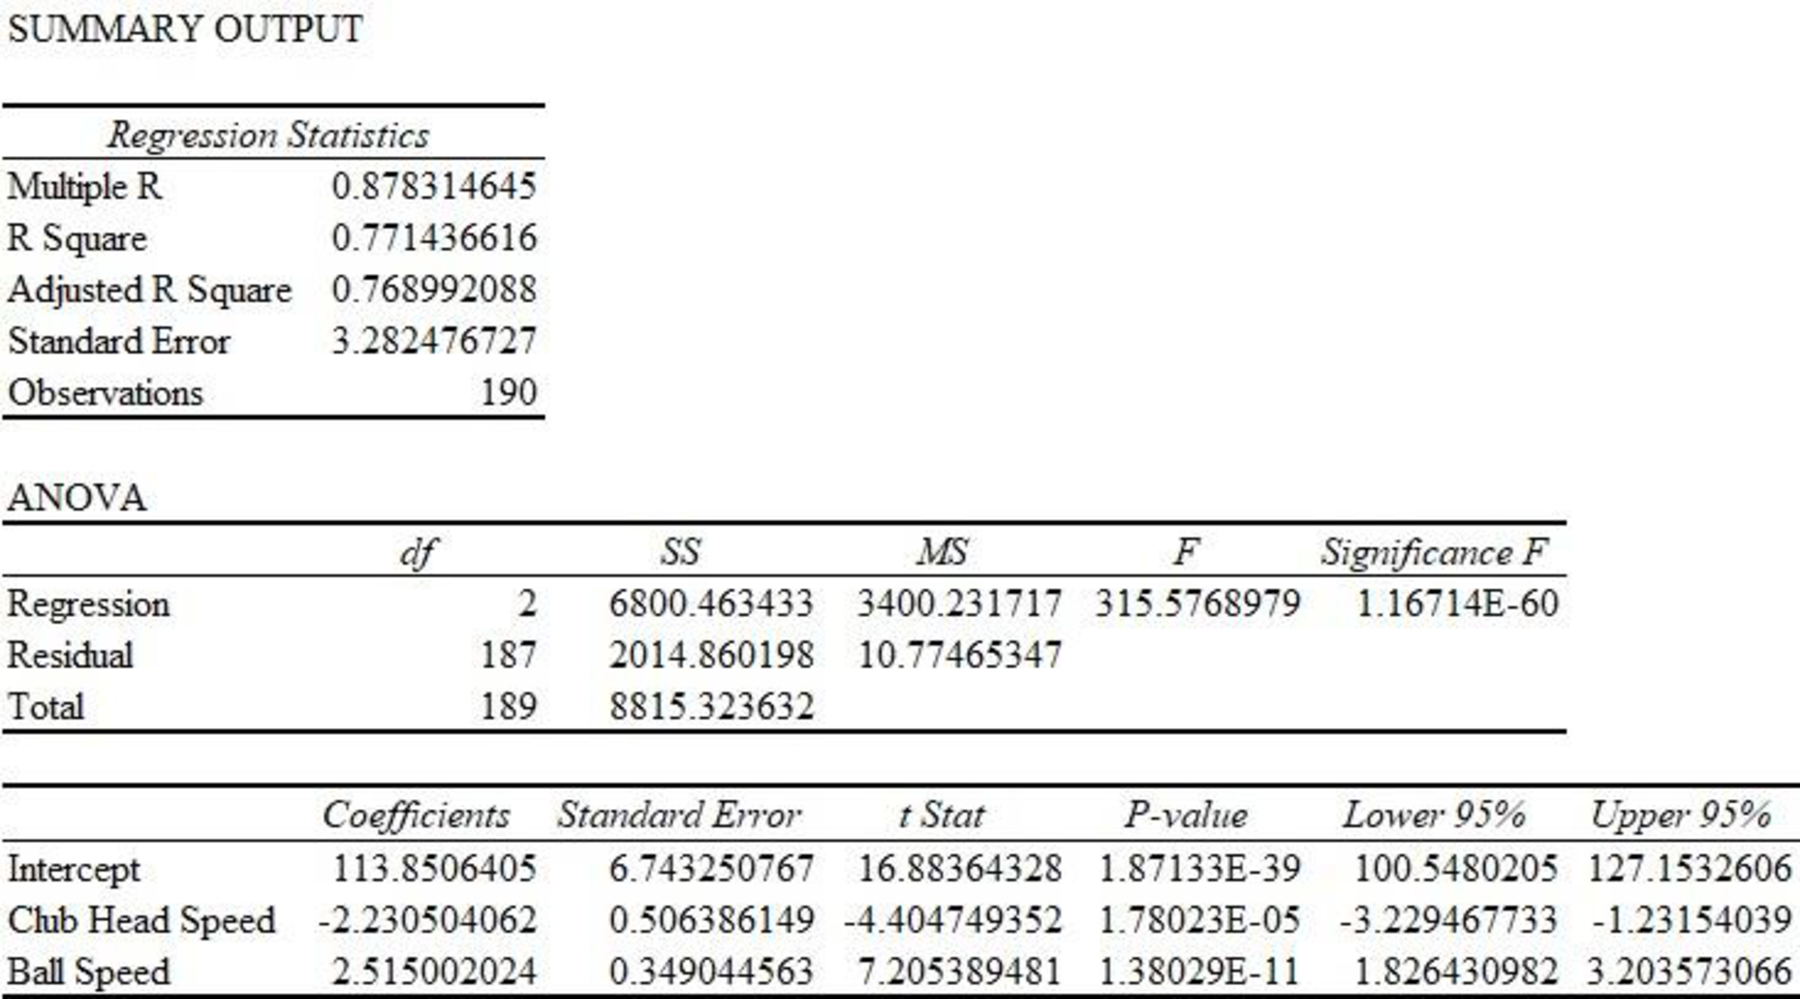
Thus, the estimated regression equation that could be used to predict the average number of yards per drive given both club head speed and ball speed is as follows:
In the given output,
Thus, only 77.14% variability in total distance can be explained by variability in club head and ball speed.
Scatter Diagram:
Software procedure:
Step-by-step procedure to obtain scatter diagram using EXCEL software:
- Open the file PGADrivingDist.
- Select the cell Range $B$1:$C$191.
- Go to insert and select scatter plot.
- Click OK
Output obtained using EXCEL software is given as follows:
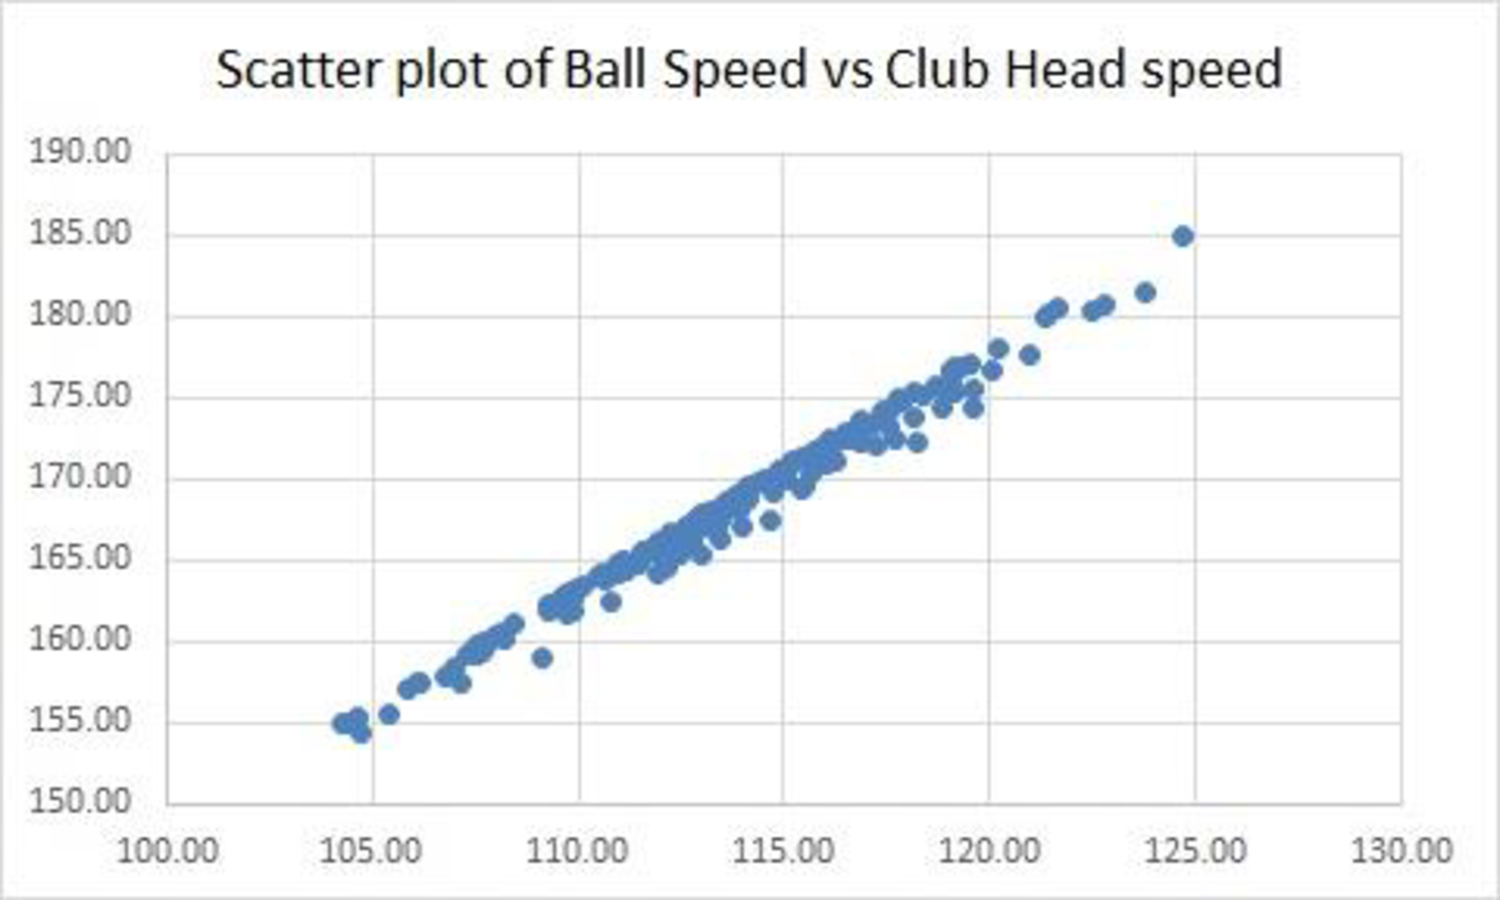
The scatter diagram exhibits a strong positive linear relationship between ball speed and club head speed. Both the variables in the same model are not recommended as the linear effect of one variable describes the linear effect of the other variable. As a result, the other variable will be of little additional value. Thus, there is a chance of multicollinearity.
Thus, developing an estimated regression equation that uses both club head speed and ball speed to predict the average number of yards per drive is not useful.
d.
Find the estimated regression equation that could be used to predict the average number of yards per drive given the ball speed and the launch angle.
Answer to Problem 9E
The estimated regression equation that could be used to predict the average number of yards per drive given both ball speed and launch angle is as follows:
Explanation of Solution
Calculation:
The regression equation can be obtained using Excel software.
Regression:
Software procedure:
Step-by-step procedure to get the regression equation using EXCEL software:
- Open the file PGADrivingDist.
- Select Data > Data Analysis > Regression.
- Click OK.
- Under Input Y Range enter $E$1:$E$191.
- Under Input X Range enter $C$1:$D$191.
- Click the box of Labels.
- Under Output Range enter $H$24.
- Click OK.
Output obtained using EXCEL software is given as follows:
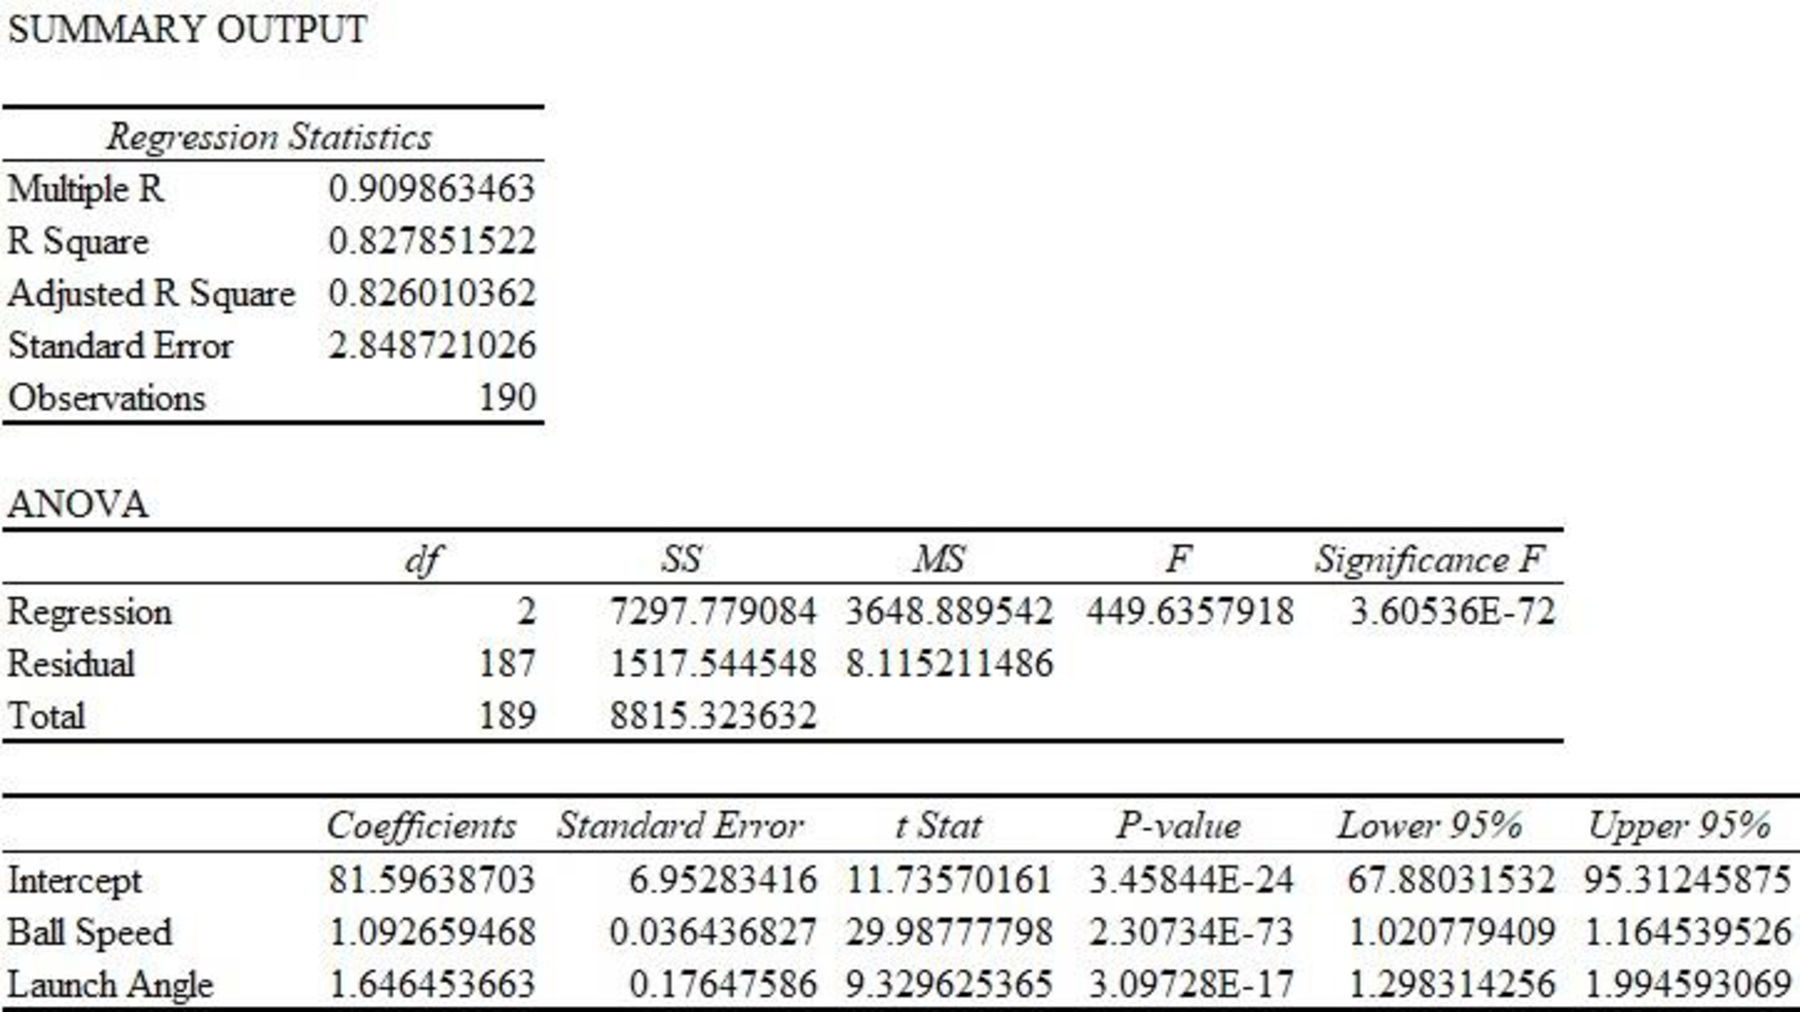
Thus, the estimated regression equation that could be used to predict the average number of yards per drive given both ball speed and launch angle is as follows:
e.
Predict the average number of yards per drive for the new player using the obtained equation in part (d).
Answer to Problem 9E
The predicted average number of yards per drive for the new player is 285.465 yards.
Explanation of Solution
Calculation:
The ball speed of a new PGA player is 170 mph with launch angle of 11 degrees.
From Part (b), it is found that the estimated regression equation that could be used to predict the average number of yards per drive given both club head speed and launch angle is
Thus, the predicted average number of yards per drive for the new player is as follows:
Thus, the predicted average number of yards per drive for the new player is 285.465 yards.
Want to see more full solutions like this?
Chapter 15 Solutions
Modern Business Statistics with Microsoft Office Excel (with XLSTAT Education Edition Printed Access Card) (MindTap Course List)


- Please use the data plot to show the contract between two teachers' data.arrow_forwardCollege students and surfers Rex Robinson and Sandy Hudson collected data on the self-reported number of days surfed in a month for 30 longboard surfers and 30 shortboard surfers. Complete parts a and b below.arrow_forwardIt’s a study guidearrow_forward
- What is the proxy or measurement of the variables for tertiary education?arrow_forwardA researcher believed that the number of rental cars in service by a car rental company would have an impact on the total annual revenue for that car rental company. Five small car rental companies were surveyed, with the number of Cars in service recorded in units of 1000 (so if a car rental company had 54000 cars in service, a 54 would be recorded) and Annual Revenue measured in millions of dollars (so an Annual Revenue of $10,000,000 would be recorded as 10). The data follows: Cars (1,000s) Annual Revenue ($ millions)11.5 118 10.0 135 9.0 100 5.5 37 3.3 32 Part of the Excel-generated Simple Linear Regression output is provided below: ANOVA df SS MS F Significance F Regression 1 7891.863897 7891.863897 22.91180151 0.017339231 Residual 3 1033.336103 344.4453677 Total 4 8925.2 Coefficients Standard Error t Stat P-value Intercept -19.12490108 23.1658578…arrow_forwardThe professionals who analyze data from social media and provide insights about customers are in _______. Group of answer choices digital marketing marketing analytics event marketing merchandisingarrow_forward
 Glencoe Algebra 1, Student Edition, 9780079039897...AlgebraISBN:9780079039897Author:CarterPublisher:McGraw Hill
 Algebra: Structure And Method, Book 1AlgebraISBN:9780395977224Author:Richard G. Brown, Mary P. Dolciani, Robert H. Sorgenfrey, William L. ColePublisher:McDougal Littell
 Holt Mcdougal Larson Pre-algebra: Student Edition...AlgebraISBN:9780547587776Author:HOLT MCDOUGALPublisher:HOLT MCDOUGAL
 Elementary Geometry For College Students, 7eGeometryISBN:9781337614085Author:Alexander, Daniel C.; Koeberlein, Geralyn M.Publisher:Cengage,
 Big Ideas Math A Bridge To Success Algebra 1: Stu...AlgebraISBN:9781680331141Author:HOUGHTON MIFFLIN HARCOURTPublisher:Houghton Mifflin Harcourt