Concept explainers
Videos
The figure shows graphs of the total cost function and the total revenue function for a commodity.
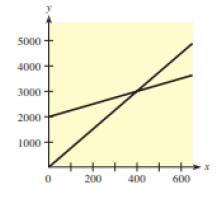
Label each function correctly.
Determine the fixed costs.
Locate the break-even point and determine the number of units sold to break even.
Estimate the marginal cost and marginal revenue.

Trending nowThis is a popular solution!

Chapter 1 Solutions
MATHMATICAL APPLICATIONS FOR THE MANAGEM
Additional Math Textbook Solutions
Mathematics for Elementary Teachers with Activities (5th Edition)
Mathematics with Applications In the Management, Natural, and Social Sciences (12th Edition)
Discrete Mathematics with Graph Theory (Classic Version) (3rd Edition) (Pearson Modern Classics for Advanced Mathematics Series)
Calculus for Business, Economics, Life Sciences, and Social Sciences (13th Edition)
Using and Understanding Mathematics: A Quantitative Reasoning Approach (6th Edition)
Finite Mathematics for Business, Economics, Life Sciences and Social Sciences


 College Algebra (MindTap Course List)AlgebraISBN:9781305652231Author:R. David Gustafson, Jeff HughesPublisher:Cengage Learning
 Calculus For The Life SciencesCalculusISBN:9780321964038Author:GREENWELL, Raymond N., RITCHEY, Nathan P., Lial, Margaret L.Publisher:Pearson Addison Wesley,
 Algebra & Trigonometry with Analytic GeometryAlgebraISBN:9781133382119Author:SwokowskiPublisher:Cengage