
Concept explainers
Videos
Recompute the regression fits from Probs. (a) 17.3 and (b) 17.17, using the matrix approach. Estimate the standard errors and develop 90% confidence intervals for the coefficients.
(a)
To calculate: The coefficient of the regression fit equation of the given databy the use of matrix approach and then calculate standard error and
| x | 0 | 2 | 4 | 6 | 9 | 11 | 12 | 15 | 17 | 19 |
| y | 5 | 6 | 7 | 6 | 9 | 8 | 7 | 10 | 12 | 12 |
Answer to Problem 22P
Solution:
The value of coefficient by the use of matrix approach is
Explanation of Solution
Given Information:
The data is,
| x | 0 | 2 | 4 | 6 | 9 | 11 | 12 | 15 | 17 | 19 |
| y | 5 | 6 | 7 | 6 | 9 | 8 | 7 | 10 | 12 | 12 |
Calculation:
The coefficient of the regression fit equation can be found out by the Matrix approach by following the below steps,
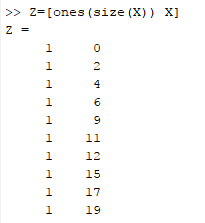
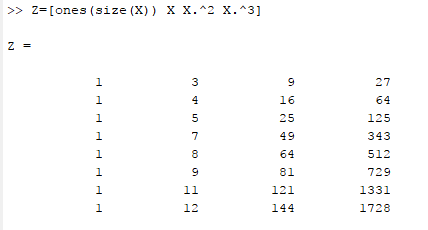
Step 1. First make Z matrix that contain column of ones in the first column and in the second column x value is shown.
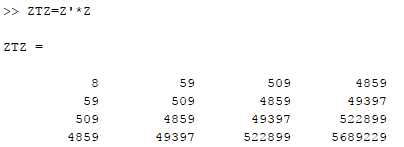
Step 2. Now the coefficient of normal equation is made.
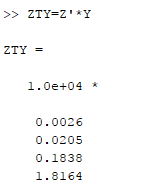
Step 3. Now compute the normal equation of the right hand side that is y data.
Step 4. The coefficient of the model can be found out by taking inverse of the result obtained in step 2 and step 3.
The following MATLAB will perform the desired steps,
On the command window, write this command as,
Now, the coefficient of normal equation is calculated as,
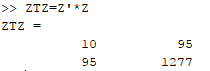
Now, the normal equation of y is calculated as,
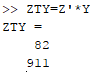
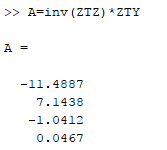
Finally, the coefficient of the model can be found out,
Therefore, the value of coefficientis
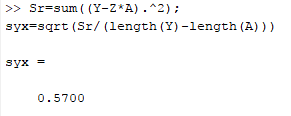
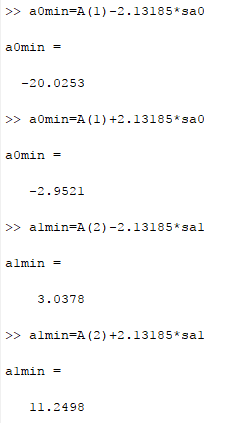
Now, for calculating the standard error follow these commands,
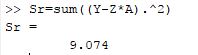
Now calculate
The standard error of the given data is
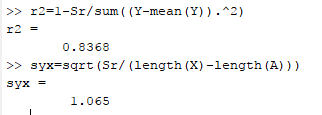
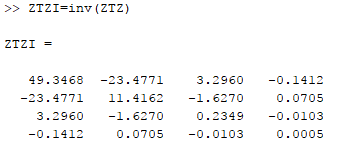
Now for calculating
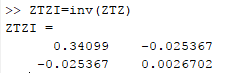
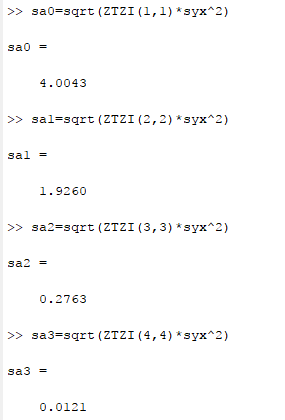
Then the standard error of each coefficient,
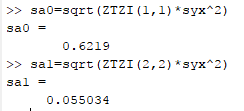
Thevalue of
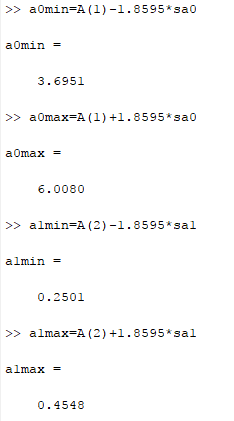
Hence, the
(b)
To calculate: The coefficient of the regression fit cubic equation of the given databy the use of matrix approach and then calculate standard error and
| x | 3 | 4 | 5 | 7 | 8 | 9 | 11 | 12 |
| y | 1.6 | 3.6 | 4.4 | 3.4 | 2.2 | 2.8 | 3.8 | 4.6 |
Answer to Problem 22P
Solution:
The value of coefficient by the use of matrix approach is
Explanation of Solution
Given Information:
The data is,
| x | 3 | 4 | 5 | 7 | 8 | 9 | 11 | 12 |
| y | 1.6 | 3.6 | 4.4 | 3.4 | 2.2 | 2.8 | 3.8 | 4.6 |
Calculation:
The coefficient of the regression fit equation can be found out by the Matrix approach by following the below steps,
Step 1. First make Z matrix that contain column of ones in the first column and in the second column x value is shown.
Step 2. Now the coefficient of normal equation is made.
Step 3. Now compute the normal equation of the right hand side that is y data.
Step 4. The coefficient of the model can be found out by taking inverse of the result obtained in step 2 and step 3.
The following MATLAB will perform the desired steps,
On the command window, write this commandfor cubic equation as,
Now, the coefficient of normal equation is calculated as,
Now, the normal equation of y is calculated as,
Finally, the coefficient of the model can be found out,
Therefore, the value of coefficient is
Now, for calculating the standard error follow these commands,
The standard error of the given data is
Now for calculating
Then the standard error of each coefficient,
The value of
And,
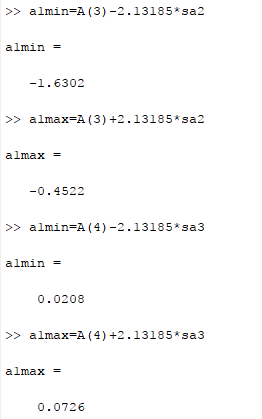
Hence, the
Want to see more full solutions like this?
Chapter 17 Solutions
Numerical Methods for Engineers


- In Australia, 16% of the adult population is nearsighted.17 If three Australians are chosen at random, what is the probability that two are nearsighted and one is not? 2.state each of the five assumptions of the classical regression model (OLS) and give an intuitive explanation of the meaning and need for each of them.arrow_forwardThe least-squares regression line relating two statistical variables is given as = 24 + 5x. Compute the residual if the actual (observed) value for y is 38 when x is 2. 4 38 2arrow_forwardFor the regression model Yi = b0 + eI, derive the least squares estimator.arrow_forward
- An econometrician suspects that the residuals of her model might be autocorrelated. Explain the steps involved in testing this theory using the Durbin–Watson (DW) testarrow_forwardIf I want to estimate the regression of a model by using OLS on Eveiws , and I chose the "keep it as general as possible" approach, what tests can I apply through the estimation and inference process to validate the model and the variables?arrow_forward1) Indicate whether the following statements are true or false. Explain why and show your work.a) In a simple regression Yi = B1 + B2 Xi + ui where var(ui) = o^2.X^2, weighting the model by X would solve the problem of non-common (heteroskedastic) variance of the error term.arrow_forward
- State the four conditions required for making regression inferences.arrow_forwardBased on the data, construct the sample regression function (SRF) and compute the variance for β0 and β1.arrow_forwardDoes the sugar cane model suffer from heteroscedasticity? Perform a Breusch-Pegan test as well as a Whitetest to verify what the residual plots suggests, based on the following regression results:arrow_forward
- The y-interept bo of a least-squares regression line has a useful interpretation only if the x-values are either all positive or all negative. Determine if the statement is true or false. Why? If the statement is false, rewrite as a true statement.arrow_forwardWhat is the slope of the least-squares regression line for these data? Carry your intermediate computations to at least four decimal places and round your answer to at least three decimal places.arrow_forwardWhat is the slope of the least-squares regression line for these data? Carry your intermediate computations to at least four decimal places and round your answer to at least two decimal places.arrow_forward
 Advanced Engineering MathematicsAdvanced MathISBN:9780470458365Author:Erwin KreyszigPublisher:Wiley, John & Sons, Incorporated
 Numerical Methods for EngineersAdvanced MathISBN:9780073397924Author:Steven C. Chapra Dr., Raymond P. CanalePublisher:McGraw-Hill Education
 Introductory Mathematics for Engineering Applicat...Advanced MathISBN:9781118141809Author:Nathan KlingbeilPublisher:WILEY
 Mathematics For Machine TechnologyAdvanced MathISBN:9781337798310Author:Peterson, John.Publisher:Cengage Learning,
