
EBK MODERN BUSINESS STATISTICS WITH MIC
5th Edition
ISBN: 9780100475038
Author: williams
Publisher: YUZU
expand_more
expand_more
format_list_bulleted
Videos
Textbook Question
Chapter 17.5, Problem 30E
The quarterly sales data (number of copies sold) for a college textbook over the past three years follow.
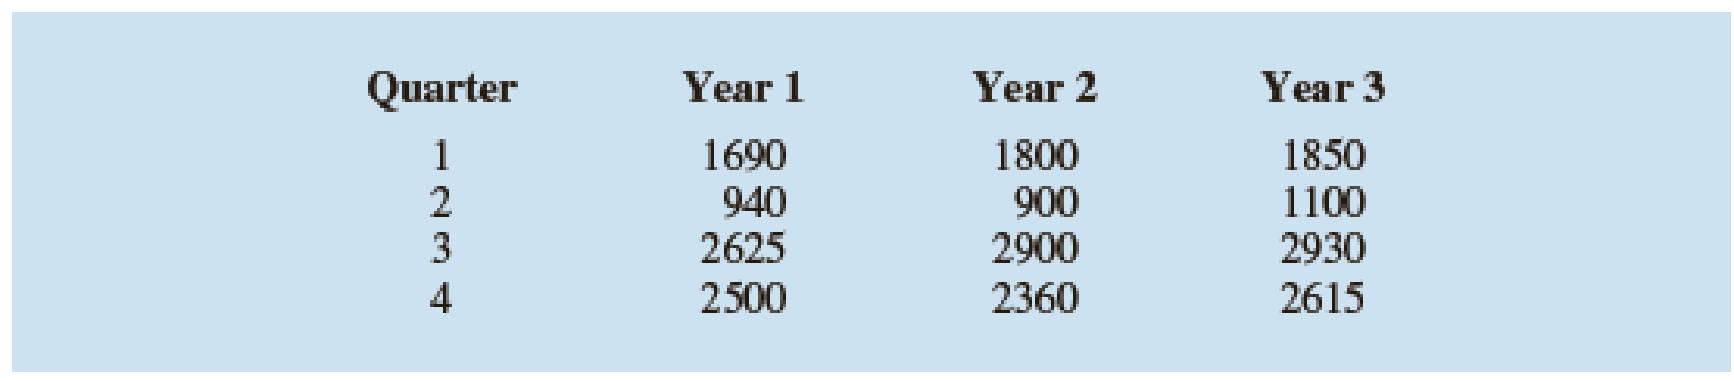
- a. Construct a time series plot. What type of pattern exists in the data?
- b. Use the following dummy variables to develop an estimated regression equation to account for any seasonal effects in the data: Qtr1 = 1 if Quarter 1, 0 otherwise; Qtr2 = 1 if Quarter 2, 0 otherwise; Qtr3 = 1 if Quarter 3, 0 otherwise.
- c. Compute the quarterly forecasts for next year.
- d. Let t = 1 to refer to the observation in quarter 1 of year 1; t = 2 to refer to the observation in quarter 2 of year 1; … and t = 12 to refer to the observation in quarter 4 of year 3. Using the dummy variables defined in part (b) and t, develop an estimated regression equation to account for seasonal effects and any linear trend in the time series. Based upon the seasonal effects in the data and linear trend, compute the quarterly forecasts for next year.
Expert Solution & Answer

Trending nowThis is a popular solution!

Students have asked these similar questions
Consider the following time series data.
Quarter Year 1 Year 2 Year 3
1 4 6 7
2 2 3 6
3 3 5 6
4 5 7 8
Choose the correct time series plot.
(i)
(ii)
(iii)
(iv)
- Plot (iii) What type of pattern exists in the data?- Horizontal Pattern with Seasonality
Use a multiple regression model with dummy variables as follows to develop an equation to account for seasonal effects in the data. Qtr1 = 1 if Quarter 1, 0 otherwise; Qtr2 = 1 if Quarter 2, 0 otherwise; Qtr3 = 1 if Quarter 3, 0 otherwise. If required, round your answers to three decimal places. For subtractive or negative numbers use a minus sign even if there is a + sign before the blank. (Example: -300)Value = fill in the blank 3 + fill in the blank 4 Qtr1 + fill in the blank 5 Qtr2 + fill in the blank 6 Qtr3 + fill in the blank 7 t
Compute the quarterly forecasts for next year. If…
Consider the following time series:
Quarter
Year 1
Year 2
Year 3
1
66
63
57
2
48
40
50
3
59
61
54
4
73
76
67
(a)
Choose a time series plot.
(i)
(ii)
(iii)
(iv)
What type of pattern exists in the data? Is there an indication of a seasonal pattern?
(b)
Use a multiple linear regression model with dummy variables as follows to develop an equation to account for seasonal effects in the data: Qtr1 = 1 if quarter 1, 0 otherwise; Qtr2 = 1 if quarter 2, 0 otherwise; Qtr3 = 1 if quarter 3, 0 otherwise. For subtractive or negative numbers use a minus sign even if there is a + sign before the blank (Example: -300).
ŷ = ?? + ?? Qtr1 +?? Qtr2 + ?? Qtr3
(c)
Compute the quarterly forecasts for next year.
Year
Quarter
Ft
4
1
4
2
4
3
4
4
Which of the following time-series forecasting methods would not be used to forecast a time series that exhibits a linear trend with no seasonal or cyclical patterns?
a. Dummy variable regression
b. Linear trend regression
c. Multiplicative Winter's method
d. Holt Winter's double exponential smoothing
e. Both A and D
Chapter 17 Solutions
EBK MODERN BUSINESS STATISTICS WITH MIC
Ch. 17.2 - 1. Consider the following time series...Ch. 17.2 - 2. Refer to the time series data in exercise 1....Ch. 17.2 - Prob. 3ECh. 17.2 - 4. Consider the following time series...Ch. 17.3 - Consider the following time series...Ch. 17.3 - Consider the following time series...Ch. 17.3 - Refer to the gasoline sales time series data in...Ch. 17.3 - Prob. 8ECh. 17.3 - 9. With the gasoline time series data from Table...Ch. 17.3 - 10. With a smoothing constant of α = .2, equation...
Ch. 17.3 - For the Hawkins Company, the monthly percentages...Ch. 17.3 - Corporate triple-A bond interest rates for 12...Ch. 17.3 - The values of Alabama building contracts (in $...Ch. 17.3 - The following time series shows the sales of a...Ch. 17.3 - Ten weeks of data on the Commodity Futures Index...Ch. 17.3 - Prob. 16ECh. 17.4 - Consider the following time series...Ch. 17.4 - Prob. 18ECh. 17.4 - Prob. 19ECh. 17.4 - Prob. 20ECh. 17.4 - Prob. 21ECh. 17.4 - Prob. 22ECh. 17.4 - The president of a small manufacturing firm is...Ch. 17.4 - FRED (Federal Reserve Economic Data), a database...Ch. 17.4 - Prob. 25ECh. 17.4 - Giovanni Food Products produces and sells frozen...Ch. 17.4 - The number of users of Facebook from 2004 through...Ch. 17.5 - Consider the following time series.
Construct a...Ch. 17.5 - Consider the following time series...Ch. 17.5 - The quarterly sales data (number of copies sold)...Ch. 17.5 - Air pollution control specialists in southern...Ch. 17.5 - South Shore Construction builds permanent docks...Ch. 17.5 - Prob. 33ECh. 17.5 - Prob. 34ECh. 17.6 - Consider the following time series...Ch. 17.6 - Refer to exercise 35.
Deseasonalize the time...Ch. 17.6 - The quarterly sales data (number of copies sold)...Ch. 17.6 - Three years of monthly lawn-maintenance expenses...Ch. 17.6 - Air pollution control specialists in southern...Ch. 17.6 - Electric power consumption is measured in...Ch. 17 - The weekly demand (in cases) for a particular...Ch. 17 - The following table reports the percentage of...Ch. 17 - United Dairies, Inc., supplies milk to several...Ch. 17 - Prob. 44SECh. 17 - The Garden Avenue Seven sells CDs of its musical...Ch. 17 - The Mayfair Department Store in Davenport, Iowa,...Ch. 17 - Prob. 47SECh. 17 - The Costello Music Company has been in business...Ch. 17 - Consider the Costello Music Company problem in...Ch. 17 - Prob. 50SECh. 17 - Refer to the Costello Music Company time series in...Ch. 17 - Prob. 52SECh. 17 - Refer to the Hudson Marine problem in exercise 52....Ch. 17 - Refer to the Hudson Marine problem in exercise...Ch. 17 - Refer to the Hudson Marine data in exercise...Ch. 17 - Forecasting Food and Beverage Sales
The Vintage...Ch. 17 - The Carlson Department Store suffered heavy damage...
Knowledge Booster


Learn more about
Need a deep-dive on the concept behind this application? Look no further. Learn more about this topic, statistics and related others by exploring similar questions and additional content below.Similar questions
- Cable TV The following table shows the number C. in millions, of basic subscribers to cable TV in the indicated year These data are from the Statistical Abstract of the United States. Year 1975 1980 1985 1990 1995 2000 C 9.8 17.5 35.4 50.5 60.6 60.6 a. Use regression to find a logistic model for these data. b. By what annual percentage would you expect the number of cable subscribers to grow in the absence of limiting factors? c. The estimated number of subscribers in 2005 was 65.3million. What light does this shed on the model you found in part a?arrow_forwardWhat does the y -intercept on the graph of a logistic equation correspond to for a population modeled by that equation?arrow_forwardConsider the following time series data. Quarter Year 1 Year 2 Year 3 1 4 6 7 2 0 1 4 3 3 5 6 4 5 7 8 (a) Choose the correct time series plot. (i) (ii) (iii) (iv) What type of pattern exists in the data? (b) Use a multiple regression model with dummy variables as follows to develop an equation to account for seasonal effects in the data: Qtr1 = 1 if Quarter 1, 0 otherwise; Qtr2 = 1 if Quarter 2, 0 otherwise; Qtr3 = 1 if Quarter 3, 0 otherwise. If required, round your answers to three decimal places. For subtractive or negative numbers use a minus sign even if there is a + sign before the blank (Example: -300). If the constant is "1" it must be entered in the box. Do not round intermediate calculation. ŷ = + Qtr1 + Qtr2 + Qtr3 (c) Compute the quarterly forecasts for next year based on the model you developed in part (b). If required, round your answers to three decimal places. Do not round…arrow_forward
- Consider the following time series data: Quarter Year 1 Year 2 Year 3 1 4 6 7 2 2 3 6 3 3 5 6 4 5 7 8 A. Use a multiple regression model with dummy variables as follows to develop an equation to account for seasonal effects in the data: Q1 if quarter 1, 0 otherwise; Q2 if quarter 2, 0 otherwise; Q3 if quarter 3, 0 otherwise. B. Use a multiple regression model to develop an equation to account for trend and seasonal effects in the data. Use the dummy variables you developed in part (A) to capture seasonal effects and create a variable "Trend" such that T=1 for quarter 1 in year 1, T=2 for quarter 2 in year1,.... T=12 for quarter 4 in year 3.arrow_forwardUsing the time series data in the table, respond to the following items. Period Sales 1 $ 1,001 2 1,129 3 841 4 1,044 5 1,014 6 703 7 682 8 712 9 646 10 686 11 909 12 469 13 566 14 488 15 688 16 675 17 303 18 381 d-1. Compute all possible forecasts using a trend forecasting model using simple linear regression? (Round your answers to 2 decimal places.) Period Sales Predicted Sales Absolute Error 1 1,001 1,026.85 25.85 2 1,129 990.60 138.40 3 841 954.35 113.35 4 1,044 918.10 125.90 5 1,014…arrow_forwardConsider the following time series data. Quarter Year 1 Year 2 Year 3 1 4 6 7 2 2 3 6 3 3 5 6 4 5 7 8 Use a multiple regression model with dummy variables as follows to develop an equation to account for seasonal effects in the data. Qtr1 = 1 if Quarter 1, 0 otherwise; Qtr2 = 1 if Quarter 2, 0 otherwise; Qtr3 = 1 if Quarter 3, 0 otherwise. If required, round your answers to three decimal places. For subtractive or negative numbers use a minus sign even if there is a + sign before the blank. (Example: -300)Value = + Qtr1 + Qtr2 + Qtr3 + t Compute the quarterly forecasts for next year. If required, round your answers to two decimal places.Quarter 1 forecast = Quarter 2 forecast = Quarter 3 forecast = Quarter 4 forecast =arrow_forward
- Consider the following time series. Quarter Year 1 Year 2 Year 3 1 71 68 62 2 49 41 51 3 58 60 53 4 78 81 72 Construct a time series plot. What type of pattern exists in the data? Use a multiple linear regression model with dummy variables as follows to develop an equation to account for seasonal effects in the data. Qtr1=1 if Quarter 1, 0 otherwise; Qtr2=1 if Quarter 2, 0 otherwise; Qtr3=1 if Quarter 3, 0 otherwise. Compute the quarterly forecast for the next year.arrow_forwardMovieflix, an online movie streaming service that offers a wide variety of award-winning TV shows, movies, animes, and documentaries, would like to determine the mathematical trend of memberships in order to project future needs.Year 2013 2014 2015 2016 2017 2018 2019 2020 2021Membership (000s)17 16 16 21 20 20 23 25 24 (i) Use the following time series data, to develop a regression equation relating memberships to time.arrow_forwardConsider the following time series data. Quarter Year 1 Year 2 Year 3 1 4 6 7 2 0 1 4 3 3 5 6 4 5 7 8 (b) Use a multiple regression model with dummy variables as follows to develop an equation to account for seasonal effects in the data: Qtr1 = 1 if Quarter 1, 0 otherwise; Qtr2 = 1 if Quarter 2, 0 otherwise; Qtr3 = 1 if Quarter 3, 0 otherwise. If required, round your answers to three decimal places. For subtractive or negative numbers use a minus sign even if there is a + sign before the blank (Example: -300). If the constant is "1" it must be entered in the box. Do not round intermediate calculation. ŷ = + Qtr1 + Qtr2 + Qtr3 (c) Compute the quarterly forecasts for next year based on the model you developed in part (b). If required, round your answers to three decimal places. Do not round intermediate calculation. Year Quarter Ft 4 1 4 2 4 3 4 4 (d) Use a multiple…arrow_forward
- Consider the following time series.t 1 2 3 4 5 6 7 Yt 120 110 100 96 94 92 88a. What type of pattern exists in the data?HorizontalSeasonal with upward trendDownward trendUpward trendSeasonal with downward trendb. Regression analysis yields the following forecast equation: 119.71 - 4.929t; what is the forecast for period 8? Round to the nearest hundredth.c. Regression analysis yields the following forecast equation: 119.71 - 4.929t; what is the MSE for this forecast method? Round to the nearest hundredth.arrow_forwardThe president of small manufacturing firm is concerned about the continual increase in manufacturing costs over the past several years. The following figures provide a time series of the cost per unit for the firm’s leading product over the past eight years. Year Cost/Unit ($) Year Cost/Unit ($) 1 20.00 5 26.60 2 24.50 6 30.00 3 28.20 7 31.00 4 27.50 8 36.00 Construct a time series plot. What type of pattern exists in the data? Use simple linear regression analysis to find the parameters for the line that minimizes MSE for this time series. What is the average cost increase that the firm has been realizing per year? Compute an estimate of the cost/unit for next year.arrow_forwardThe table below shows (lifetime) peptic ulcer rates (per 100 population), ?, for various family incomes, ?, as reported by the 1989 National Health Interview Survey. Income 4000 6000 8000 12000 16000 20000 30000 45000 60000 Ulcer rate 13.7 13.8 13.4 12.9 12.9 12.4 11.2 10 8.8 (a) Find the equation of the regression line. Ulcer rate, ?(?)= . (b) Estimate the peptic ulcer rate for an income level of ?0 = 29000 according to the linear model in part (a). Ulcer rate, ?(?0)= .arrow_forward
arrow_back_ios
arrow_forward_ios
Recommended textbooks for you
 College AlgebraAlgebraISBN:9781305115545Author:James Stewart, Lothar Redlin, Saleem WatsonPublisher:Cengage Learning
 Functions and Change: A Modeling Approach to Coll...AlgebraISBN:9781337111348Author:Bruce Crauder, Benny Evans, Alan NoellPublisher:Cengage Learning
 Glencoe Algebra 1, Student Edition, 9780079039897...AlgebraISBN:9780079039897Author:CarterPublisher:McGraw Hill
College Algebra
Algebra
ISBN:9781305115545
Author:James Stewart, Lothar Redlin, Saleem Watson
Publisher:Cengage Learning
Functions and Change: A Modeling Approach to Coll...
Algebra
ISBN:9781337111348
Author:Bruce Crauder, Benny Evans, Alan Noell
Publisher:Cengage Learning
Glencoe Algebra 1, Student Edition, 9780079039897...
Algebra
ISBN:9780079039897
Author:Carter
Publisher:McGraw Hill
Time Series Analysis Theory & Uni-variate Forecasting Techniques; Author: Analytics University;https://www.youtube.com/watch?v=_X5q9FYLGxM;License: Standard YouTube License, CC-BY
Operations management 101: Time-series, forecasting introduction; Author: Brandoz Foltz;https://www.youtube.com/watch?v=EaqZP36ool8;License: Standard YouTube License, CC-BY