
EBK MODERN BUSINESS STATISTICS WITH MIC
5th Edition
ISBN: 9780100475038
Author: williams
Publisher: YUZU
expand_more
expand_more
format_list_bulleted
Videos
Textbook Question
Chapter 17, Problem 51SE
Refer to the Costello Music Company time series in exercise 49.
- a. Deseasonalize the data and use the deseasonalized time series to identify the trend.
- b. Use the results of part (a) to develop a quarterly forecast for next year based on trend.
- c. Use the seasonal indexes developed in exercise 50 to adjust the forecasts developed in part (b) to account for the effect of season.
49. Consider the Costello Music Company problem in exercise 48. The quarterly sales data follow.
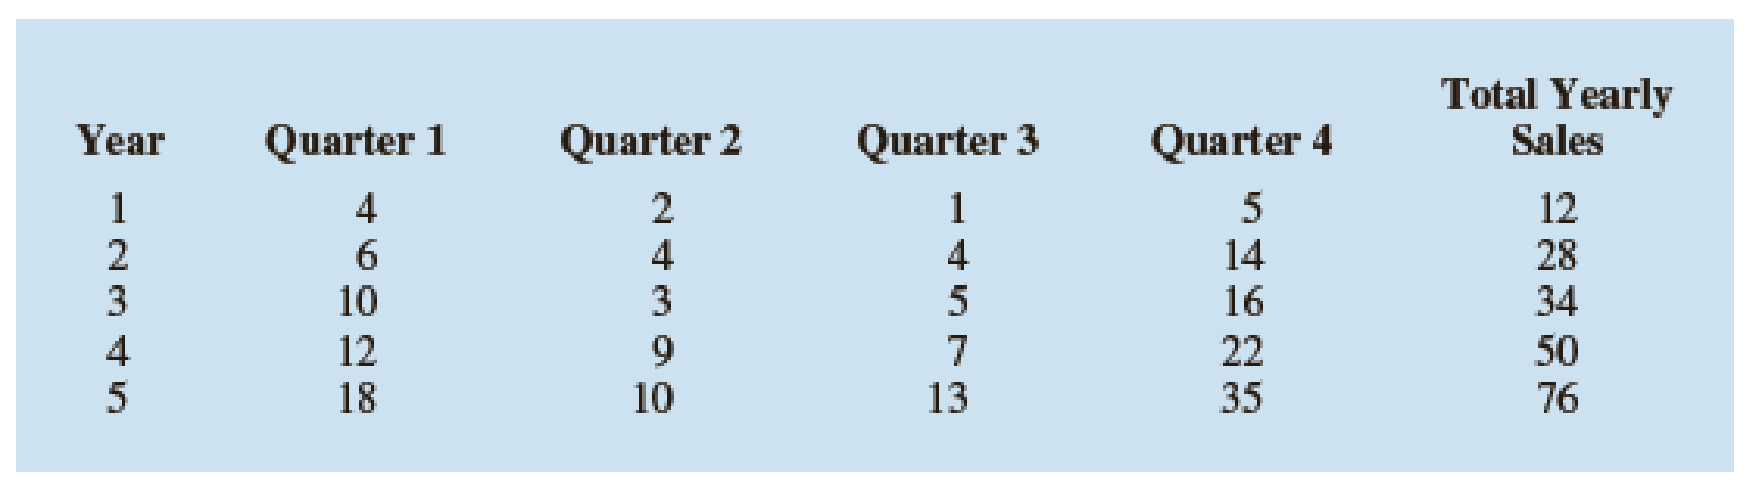
- a. Use the following dummy variables to develop an estimated regression equation to account for any seasonal and linear trend effects in the data: Qtr1 = 1 if Quarter 1, 0 otherwise; Qtr2 = 1 if Quarter 2, 0 otherwise; and Qtr3 = 1 if Quarter 3, 0 otherwise.
- b. Compute the quarterly forecasts for next year.
Expert Solution & Answer
Want to see the full answer?
Check out a sample textbook solution
Students have asked these similar questions
The president of State University wants to forecast student enrollments for this Year
academic year based on the following historical data:
5 years ago
4 years ago
3 years ago
2 years ago Last year
Enrollments
15.000
16.000 18.000
20.000 21.000
a- What is the forecast for this year using a 3-year weighted moving average where the weights are halved in a descending order from newest to oldest ?
b. What is the forecast for this year using the trend line for these data? c. using the MAD find which forecasting technique may be appropriate for this quetion
Find out the next month after april income by using the forecasting method of the moving average method
Using the accompanying table, determine the most appropriate forecasting technique for the accompanying data about the Dow Jones Industrial Average yearly closing value and implement the model.
Year
Close
1983
1258.64
1984
1211.57
1985
1546.67
1986
1895.95
1987
1938.83
1988
2168.57
1989
2753.2
1990
2633.66
1991
3168.83
1992
3301.11
1993
3754.09
1994
3834.44
1995
5117.12
1996
6448.27
1997
7908.25
1998
9181.43
1999
11497.12
2000
10786.85
2001
10021.5
2002
8341.63
2003
10453.92
2004
10783.01
2005
10717.5
2006
12463.15
2007
13264.82
2008
8776.39
2009
10428.05
2010
11557.5
2011
12217.6
2012
13104.1
Use the model forecast the closing value for 2015.Use α=0.7,β=0.3,and γ=0.4,as needed. F2015?
Chapter 17 Solutions
EBK MODERN BUSINESS STATISTICS WITH MIC
Ch. 17.2 - 1. Consider the following time series...Ch. 17.2 - 2. Refer to the time series data in exercise 1....Ch. 17.2 - Prob. 3ECh. 17.2 - 4. Consider the following time series...Ch. 17.3 - Consider the following time series...Ch. 17.3 - Consider the following time series...Ch. 17.3 - Refer to the gasoline sales time series data in...Ch. 17.3 - Prob. 8ECh. 17.3 - 9. With the gasoline time series data from Table...Ch. 17.3 - 10. With a smoothing constant of α = .2, equation...
Ch. 17.3 - For the Hawkins Company, the monthly percentages...Ch. 17.3 - Corporate triple-A bond interest rates for 12...Ch. 17.3 - The values of Alabama building contracts (in $...Ch. 17.3 - The following time series shows the sales of a...Ch. 17.3 - Ten weeks of data on the Commodity Futures Index...Ch. 17.3 - Prob. 16ECh. 17.4 - Consider the following time series...Ch. 17.4 - Prob. 18ECh. 17.4 - Prob. 19ECh. 17.4 - Prob. 20ECh. 17.4 - Prob. 21ECh. 17.4 - Prob. 22ECh. 17.4 - The president of a small manufacturing firm is...Ch. 17.4 - FRED (Federal Reserve Economic Data), a database...Ch. 17.4 - Prob. 25ECh. 17.4 - Giovanni Food Products produces and sells frozen...Ch. 17.4 - The number of users of Facebook from 2004 through...Ch. 17.5 - Consider the following time series.
Construct a...Ch. 17.5 - Consider the following time series...Ch. 17.5 - The quarterly sales data (number of copies sold)...Ch. 17.5 - Air pollution control specialists in southern...Ch. 17.5 - South Shore Construction builds permanent docks...Ch. 17.5 - Prob. 33ECh. 17.5 - Prob. 34ECh. 17.6 - Consider the following time series...Ch. 17.6 - Refer to exercise 35.
Deseasonalize the time...Ch. 17.6 - The quarterly sales data (number of copies sold)...Ch. 17.6 - Three years of monthly lawn-maintenance expenses...Ch. 17.6 - Air pollution control specialists in southern...Ch. 17.6 - Electric power consumption is measured in...Ch. 17 - The weekly demand (in cases) for a particular...Ch. 17 - The following table reports the percentage of...Ch. 17 - United Dairies, Inc., supplies milk to several...Ch. 17 - Prob. 44SECh. 17 - The Garden Avenue Seven sells CDs of its musical...Ch. 17 - The Mayfair Department Store in Davenport, Iowa,...Ch. 17 - Prob. 47SECh. 17 - The Costello Music Company has been in business...Ch. 17 - Consider the Costello Music Company problem in...Ch. 17 - Prob. 50SECh. 17 - Refer to the Costello Music Company time series in...Ch. 17 - Prob. 52SECh. 17 - Refer to the Hudson Marine problem in exercise 52....Ch. 17 - Refer to the Hudson Marine problem in exercise...Ch. 17 - Refer to the Hudson Marine data in exercise...Ch. 17 - Forecasting Food and Beverage Sales
The Vintage...Ch. 17 - The Carlson Department Store suffered heavy damage...
Knowledge Booster


Learn more about
Need a deep-dive on the concept behind this application? Look no further. Learn more about this topic, statistics and related others by exploring similar questions and additional content below.Similar questions
- Don Williams received a memo requesting that he complete a trend analysis of the following numbers using 2021 as the base year. 2024 2023 2022 2021 Sales $ 340,000 $ 400,000 $ 420,000 $ 500,000 Gross profit 180,000 240,000 340,000 400,000 Net income 70,000 90,000 40,000 50,000 Could you help Don with the request? Note: Round your answers to the nearest whole percent.arrow_forwardAmex PLC has gathered following information on the sales of face mask from April 2020 toSeptember 2020.Month Sales ($)April 17,000May 18,000June 19,500July 22,000August 21,000September 23,000You are required to;a. Using linear trend equation forecast the sales of face masks for October 2020.arrow_forwardConsider the table. Sales on Toaster Ovens 2004 2005 2006 2007 2008 Super Deluxe $86,100 $140,500 $65,800 $56,100 $59,000 Deluxe 103,200 136,100 129,900 133,800 75,400 Standard 147,300 123,600 125,500 132,600 58,000 What percent of the total sales in 2004 were the deluxe model? (Round to the nearest tenth percent.)arrow_forward
- John Kittle, an independent insurance agent, uses a five-year moving average to forecast the number of claims made in a single year for one of the large insurance companies he sells for. He has just discovered that a clerk in his employ incorrectly entered the number of claims made four years ago as 1,400 when it should have been 1,200.a. What adjustment should Mr. Kittle make in next year’s forecast to take into account the corrected value of the number of claims four years ago?b. Suppose that Mr. Kittle used simple exponential smoothing with a = .2instead of moving averages to determine his forecast. What adjustment is now required in next year’s forecast? (Note that you do not need to know the value of the forecast for next year in order to solve this problem.)arrow_forwardIf year one equals P800,000, year two equals P840,000, and year three equals P896,000, the percentage to be assigned for year three in a trend analysis, assuming that year 1 is the base year, is a. 105%. b. 89%. c. 100%. d. 112%.arrow_forwardIn a particularly small region in the Philippines, the consumer price index C depends onarrow_forward
- Use the following Sales Data to a) Develop a 4-month moving average forecast, a forecast for January, and compute the MAD. b)Develop 3-month moving average forecast, a forecast for January, and calculate a MAD. c) Which model should be used in the future? Explain why this is your answer. Month Actual Shed Sales January 10 February 12 March 13 April 16 May 19 June 23 July 26 August 30 September 28 October 18 November 16 December 14arrow_forwardWhich of the following time series forecasting methods would not be used to forecast seasonal data?arrow_forwardUsing the data in Table 6–11, calculate a 3-month moving average forecast for month 12.arrow_forward
- The report “Daily Cigarette Use: Indicators on Children and Youth" (Child Trends Data Bank, childtrends.org/wp-content/uploads/2012/11/03 _Smoking_new.pdf, retrieved April 17, 2017) included the accompanying data on the percentage of students who report smoking cigarettes daily, for students in grades 8, 10, and 12. Construct a time series plot for students in grade 12, and comment on any trend over time. Construct a time series plot that shows trends over time for each of the three grade levels. Graph each of the three-time series on the same set of axes, using different colors to distinguish the different grade levels. Either label the time series in the plot or include a legend to indicate which time series corresponds to which grade level. Write a paragraph based on the plot from Part (b). Discuss the similarities and differences for the three grade levelsarrow_forward13. Does the following have a positive, negative, or neutral trend?arrow_forwardThe Bank of Canada is interested in studying the relationship between mortgage rates and medianhome prices. The data is provided belowYear interest rate (%) Median home price1988 10.30 $183,8001989 10.30 $183,2001990 10.10 $174,9001991 9.30 $173,5001992 8.40 $172,9001993 7.30 $173,2001994 8.40 $173,2001995 7.90 $169,7001996 7.60 $174,5001997 7.60 $177,9001998 6.90 $188,1001999 7.40 $203,2002000 8.10 $230,2002001 7.00 $258,2002002 6.50 $309,8002003 5.80 $329,8002004 5.80 $431,0002005 5.80 $515,0002006 6.40 $537,0002007 6.30 $496,0002008 6.00 $352,0002009 5.00 $232,0002010 4.70 $291,7002011 4.40 $262,9002012 3.60 $299,2002013 4.00 $321,2002014 4.10 $373,5002015 3.80 $358,1002016 3.60 $382,5002017 4.00 $402,900a) Estimate a simple linear regression model and find the value of the parameters for theestimation of mortgage rates and the median home price. All JASP input files and outputtables should be provided. Interpret the intercept and the slope coefficientsb) State the correlation…arrow_forward
arrow_back_ios
SEE MORE QUESTIONS
arrow_forward_ios
Recommended textbooks for you
 MATLAB: An Introduction with ApplicationsStatisticsISBN:9781119256830Author:Amos GilatPublisher:John Wiley & Sons Inc
 Probability and Statistics for Engineering and th...StatisticsISBN:9781305251809Author:Jay L. DevorePublisher:Cengage Learning
 Statistics for The Behavioral Sciences (MindTap C...StatisticsISBN:9781305504912Author:Frederick J Gravetter, Larry B. WallnauPublisher:Cengage Learning
 Elementary Statistics: Picturing the World (7th E...StatisticsISBN:9780134683416Author:Ron Larson, Betsy FarberPublisher:PEARSON
 The Basic Practice of StatisticsStatisticsISBN:9781319042578Author:David S. Moore, William I. Notz, Michael A. FlignerPublisher:W. H. Freeman
 Introduction to the Practice of StatisticsStatisticsISBN:9781319013387Author:David S. Moore, George P. McCabe, Bruce A. CraigPublisher:W. H. Freeman
MATLAB: An Introduction with Applications
Statistics
ISBN:9781119256830
Author:Amos Gilat
Publisher:John Wiley & Sons Inc
Probability and Statistics for Engineering and th...
Statistics
ISBN:9781305251809
Author:Jay L. Devore
Publisher:Cengage Learning
Statistics for The Behavioral Sciences (MindTap C...
Statistics
ISBN:9781305504912
Author:Frederick J Gravetter, Larry B. Wallnau
Publisher:Cengage Learning
Elementary Statistics: Picturing the World (7th E...
Statistics
ISBN:9780134683416
Author:Ron Larson, Betsy Farber
Publisher:PEARSON
The Basic Practice of Statistics
Statistics
ISBN:9781319042578
Author:David S. Moore, William I. Notz, Michael A. Fligner
Publisher:W. H. Freeman
Introduction to the Practice of Statistics
Statistics
ISBN:9781319013387
Author:David S. Moore, George P. McCabe, Bruce A. Craig
Publisher:W. H. Freeman
Time Series Analysis Theory & Uni-variate Forecasting Techniques; Author: Analytics University;https://www.youtube.com/watch?v=_X5q9FYLGxM;License: Standard YouTube License, CC-BY
Operations management 101: Time-series, forecasting introduction; Author: Brandoz Foltz;https://www.youtube.com/watch?v=EaqZP36ool8;License: Standard YouTube License, CC-BY