
Videos
The weekly demand (in cases) for a particular brand of automatic dishwasher detergent for a chain of grocery stores located in Columbus, Ohio, follows.

- a. Construct a time series plot. What type of pattern exists in the data?
- b. Use a three-week moving average to develop a forecast for week 11.
- c. Use exponential smoothing with a smoothing constant of α = .2 to develop a forecast for week 11.
- d. Which of the two methods do you prefer? Why?
a.
Construct the time series plot.
Explain the type of pattern.
Answer to Problem 41SE
The time series plot is given below:
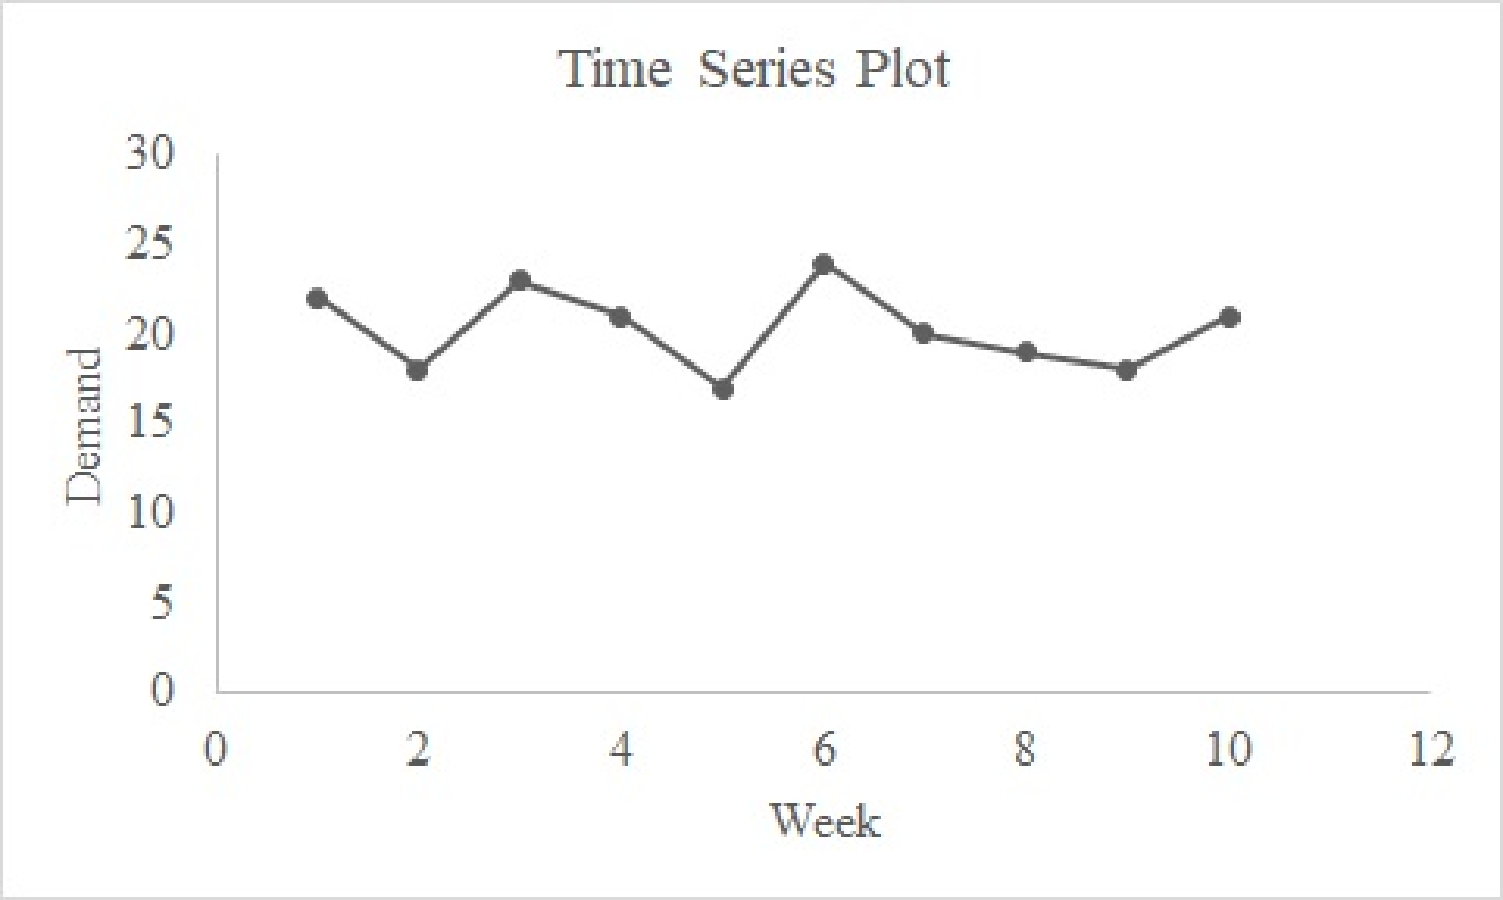
The pattern that appears in the graph is a horizontal pattern.
Explanation of Solution
Calculation:
The given data represent the weekly demand for automatic dishwasher detergent.
Software procedure:
Step-by-step software procedure to draw the time series plot using EXCEL:
- Open an EXCEL file.
- In column A, enter the data of Week, and in column B, enter the corresponding values of Demand.
- Select the data that are to be displayed.
- Click on the Insert Tab > select Scatter icon.
- Choose a Scatter with Straight Lines and Markers.
- Click on the chart > select Layout from the Chart Tools.
- Select Chart Title > Above Chart and enter Time Series Plot.
- Select Axis Title > Primary Horizontal Axis Title > Title Below Axis.
- Enter Week in the dialog box.
- Select Axis Title > Primary Vertical Axis Title > Rotated Title.
- Enter Demand in the dialog box.
From the output, the pattern that appears in the graph is a horizontal pattern.
b.
Calculate the forecast for week 11 using three-week moving averages.
Answer to Problem 41SE
The forecast for week 11 using three-week moving averages is 19.33.
Explanation of Solution
Calculation:
The forecast for week 11 using three-week moving averages is to be obtained.
Software procedure:
Step-by-step procedure to obtain the forecasts using EXCEL:
- In column A, enter the data of Month, and in column B, enter the corresponding values of Demand.
- In Data, select Data Analysis and choose Moving Average.
- In Input Range, select Demand.
- Select Label in First Row.
- In Interval, enter 3.
- In Output Range, select C3.
- Click OK.
Output using the EXCEL software is given below:
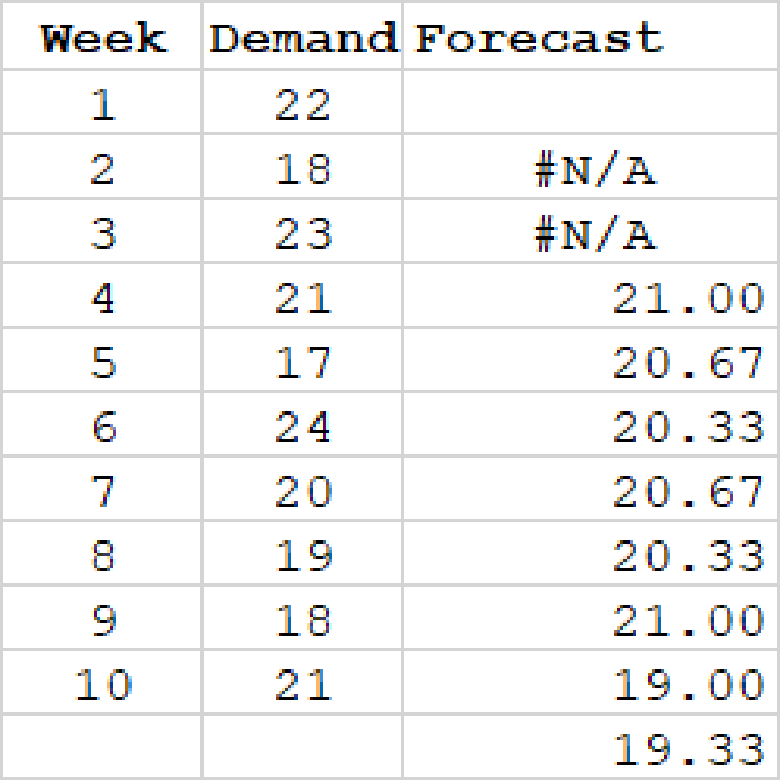
From the output, the forecast value for week 11 is 19.33.
c.
Calculate the forecast for week 11 using the exponential smoothing with constant 0.2.
Answer to Problem 41SE
The forecast for week 11 using the exponential smoothing with constant 0.2 is 20.14.
Explanation of Solution
Calculation:
It is given that
Software procedure:
Step-by-step procedure to obtain the forecasts using EXCEL:
- In column A, enter the data of Week, and in column B, enter the corresponding values of Demand.
- Select Data Analysis and choose Exponential Smoothing.
- In Input Range, select Demand.
- In Damping factor, enter 0.8.
- Select Label in First Row.
- In Output Range, select C2.
- Click OK.
Output using the EXCEL software is given below:
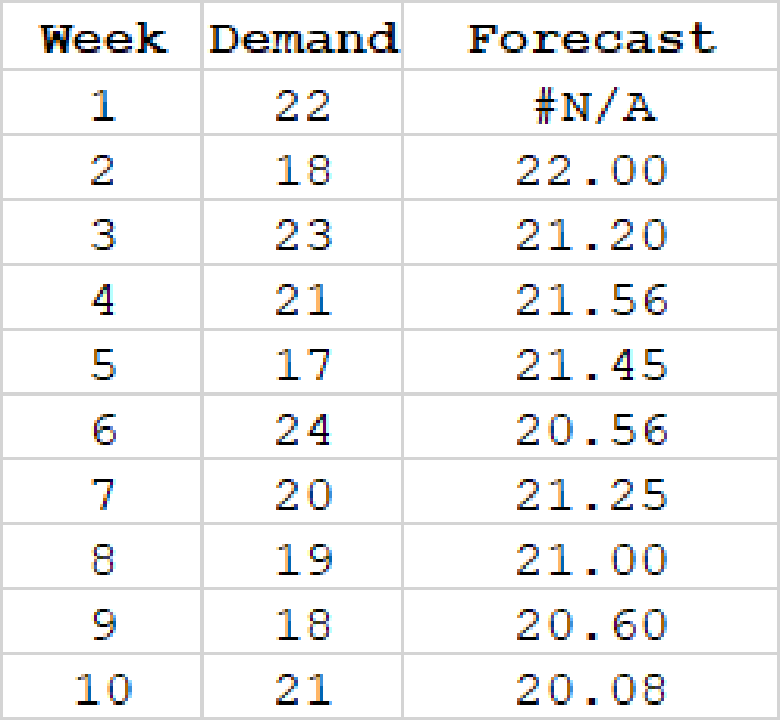
The forecast value for week 11 using exponential smoothing method is obtained as follows:
Here,
Thus, the forecast value for week 11 is 20.26.
d.
Identify the most preferable method between three-week moving averages and exponential smoothing. Explain the reason.
Answer to Problem 41SE
The three-week moving average gives the most accurate forecast because MSE for three-week moving averages is lesser when compared to the MSE for exponential smoothing.
Explanation of Solution
The formula for finding the forecast error2 is as follows:
For Week 3:
The forecast error2 for week 4 for 3-week moving average is obtained as follows:
The remaining forecasts errors2 for exponential smoothing averages are obtained as follows:
| Week | Demand | Forecast (Ft) for 3-Week Moving Average | (Forecast Error)2 | Forecast (Ft) for | (Forecast Error)2 |
| 1 | 7.35 | - | - | - | - |
| 2 | 7.4 | - | - | 22.00 | 16.00 |
| 3 | 7.55 | - | - | 21.20 | 3.24 |
| 4 | 7.56 | 21.00 | 0.00 | 21.56 | 0.31 |
| 5 | 7.6 | 20.67 | 13.44 | 21.45 | 19.78 |
| 6 | 7.52 | 20.33 | 13.44 | 20.56 | 11.84 |
| 7 | 7.52 | 20.67 | 0.44 | 21.25 | 1.55 |
| 8 | 7.7 | 20.33 | 1.78 | 21.00 | 3.99 |
| 9 | 7.62 | 21.00 | 9.00 | 20.60 | 6.75 |
| 10 | 7.55 | 19.00 | 4.00 | 20.08 | 0.85 |
| Total | 42.11 | 64.33 |
The MSE for 3-week moving average is obtained as follows:
Thus, the value of MSE for 3-week moving average is 6.02.
The MSE for exponential smoothing averages for
Thus, the value of MSE for exponential smoothing averages for
Here, it is observed that the MSE for three-week moving averages is lesser when compared to the MSE for exponential smoothing. Thus, the three-week moving average gives the most accurate forecast.
Want to see more full solutions like this?
Chapter 17 Solutions
EBK MODERN BUSINESS STATISTICS WITH MIC


- What does the y -intercept on the graph of a logistic equation correspond to for a population modeled by that equation?arrow_forwardConsider the following time series data Month 1 2 3 4 5 6 7 8 9 10 11 12 Value 80 82 84 83 83 84 85 84 82 83 84 83 a) Construct a time serie plot in Excel. Label the axes and graph. b) Develop a three month moving average forecast. Compute MSE and a forecast for month 13. c) Develop an exponential smoothing forecast with a = 0.35. Compute MSE and a forecast for month 13. d) Which model is the better predictor based on the MSE?arrow_forwardConsider the following data:Monthly Profit of an Auto Repair Shop Month Jan-14 Feb-14 Mar-14 Apr-14 May-14 Jun-14 Jul-14 Aug-14 Sep-14 Profit ($) 17,527 17,677 16,455 18,642 20,163 17,350 19,127 18,622 20,422 Step 3 of 4 : Determine the exponential smoothing forecast for the next time period using a smoothing constant of 0.35. If necessary, round your answer to one decimal place. I have been stuck on this for 2 days now. I do not understand exponential smoothing forecast at all and the textbook is not helpful. I have tried looking at the textbook, using the step-by-step learning tools, and youtube videos and it still isn't helping.arrow_forward
- Consider the following time series data Month 1 2 3 4 5 6 7 8 9 10 11 12 Value 90 89 86 91 90 91 88 86 91 93 90 88 a) Construct a time series plot in Excel. Label the axes and graph. b) Develop a five month moving average forecast. Compute MSE and a forecast for month 13. c) Develop a smoothing model forecast with α = 0.35. Compute MSE and forecast for month 13 d) Which model is the better predictor? Why?arrow_forwardFor the Hawkins Company, the monthly percentages of all shipments received on time over the past 12 months are 80, 82, 84, 83, 83, 84, 85, 84, 82, 83, 84, and 83. a. Compute for a 3 month moving average forecast. b. Compute for the exponential smoothing forecast for a=0.2. c. Which provides the better forecast using MSE as the measure of model accuracy? d. What is the forecast for next month?arrow_forwardConsider the following time series: Quarter Year 1 Year 2 Year 3 1 66 63 57 2 48 40 50 3 59 61 54 4 73 76 67 (a) Choose a time series plot. (i) (ii) (iii) (iv) What type of pattern exists in the data? Is there an indication of a seasonal pattern? (b) Use a multiple linear regression model with dummy variables as follows to develop an equation to account for seasonal effects in the data: Qtr1 = 1 if quarter 1, 0 otherwise; Qtr2 = 1 if quarter 2, 0 otherwise; Qtr3 = 1 if quarter 3, 0 otherwise. For subtractive or negative numbers use a minus sign even if there is a + sign before the blank (Example: -300). ŷ = ?? + ?? Qtr1 +?? Qtr2 + ?? Qtr3 (c) Compute the quarterly forecasts for next year. Year Quarter Ft 4 1 4 2 4 3 4 4arrow_forward
- Consider the following time series.t 1 2 3 4 5 6 7 Yt 120 110 100 96 94 92 88a. What type of pattern exists in the data?HorizontalSeasonal with upward trendDownward trendUpward trendSeasonal with downward trendb. Regression analysis yields the following forecast equation: 119.71 - 4.929t; what is the forecast for period 8? Round to the nearest hundredth.c. Regression analysis yields the following forecast equation: 119.71 - 4.929t; what is the MSE for this forecast method? Round to the nearest hundredth.arrow_forwardConsider the following time series data. Week 1 2 3 4 5 6 Value 18 13 16 11 17 14 Construct a time series plot. What type of pattern exist in the data? Develop a three-week moving average for this time series. Compute MSE and forecast for week 7. Use a = 0.2 to compute the exponential smoothing values for the time series. Compute MSE and forecast for week 7.arrow_forwardConsider the following time series data Month 1 2 3 4 5 6 7 8 9 10 11 12 Value 80 82 84 83 83 84 85 84 82 83 84 83 a) Construct a time series plot in Excel. Label the axes and graph. b) Develop a three month moving average forecast. Compute MSE and a forecast for month 13. c) Develop an exponential smoothing forecast with a = 0.35. Compute MSE and a forecast for month 13.arrow_forward
- Consider the following time series data Week 1 2 3 4 5 6 Value 18 13 16 11 17 14 a. Construct a time series plot. What type of pattern exists in the data?b. Develop the three-week moving average forecasts for this time series. compute MSE and a forecast for week 7.c. Use α = .2 to compute the exponential smoothing forecasts for the time series.Compute MSE and a forecast for week 7.d. Compare the three-week moving average approach with the exponentialsmoothing approach using α = .2. Which appears to provide more accurate forecasts based on MSE? explain.e. Use a smoothing constant of α = .4 to compute the exponential smoothing forecasts. does a smoothing constant of .2 or .4 appear to provide more accurate forecasts based on MSE? explain.arrow_forwardWith the gasoline time series data from the given table, show the exponential smoothing forecasts using = 0.1. Week Sales (1000s of gallons) 1 17 2 21 3 19 4 23 5 18 6 16 7 20 8 18 9 22 10 20 11 15 12 22 Applying the MSE measure of forecast accuracy, would you prefer a smoothing constant of = 0.1 or = 0.2 for the gasoline sales time series? Do not round your interim computations and round your final answers to two decimal places. = 0.1 = 0.2 MSE fill in the blank 1 fill in the blank 2 Prefer: 01. or 0.2 2. Are the results the same if you apply MAE as the measure of accuracy? Do not round your interim computations and round your final answers to two decimal places. = 0.1 = 0.2 MAE fill in the blank 4 fill in the blank 5 Prefer: 0.1 or 0.2 3. What are the results if MAPE is used? Do not round your interim computations and round your final answers to two decimal places. = 0.1 = 0.2 MAPE fill in…arrow_forwardConsider the following time series data. Quarter Year 1 Year 2 Year 3 1 4 6 7 2 0 1 4 3 3 5 6 4 5 7 8 (a) Choose the correct time series plot. (i) (ii) (iii) (iv) What type of pattern exists in the data? (b) Use a multiple regression model with dummy variables as follows to develop an equation to account for seasonal effects in the data: Qtr1 = 1 if Quarter 1, 0 otherwise; Qtr2 = 1 if Quarter 2, 0 otherwise; Qtr3 = 1 if Quarter 3, 0 otherwise. If required, round your answers to three decimal places. For subtractive or negative numbers use a minus sign even if there is a + sign before the blank (Example: -300). If the constant is "1" it must be entered in the box. Do not round intermediate calculation. ŷ = + Qtr1 + Qtr2 + Qtr3 (c) Compute the quarterly forecasts for next year based on the model you developed in part (b). If required, round your answers to three decimal places. Do not round…arrow_forward
 College AlgebraAlgebraISBN:9781305115545Author:James Stewart, Lothar Redlin, Saleem WatsonPublisher:Cengage Learning
 Algebra and Trigonometry (MindTap Course List)AlgebraISBN:9781305071742Author:James Stewart, Lothar Redlin, Saleem WatsonPublisher:Cengage Learning