
Concept explainers
Videos
Your function should use polyfit to determine the parameters of the boundary lines (assumed linear). The endpoints of the lines are noted or the graph. You should NOT calculate the slopes and intercepts manually.
You are part of a team designing a game to hit a target A “gun” will fire a short pulse of light at a light-sensitive screen, and the coordinates of the location where the pulse hits the screen will be captured in the variables X (horizontal) and Y (vertical). The values in X and Y will be between –4 and 4 unless the player misses the screen altogether, in which case both X and Y contain –99. The software and hardware to accomplish all of the above are being designed by more experienced team members.
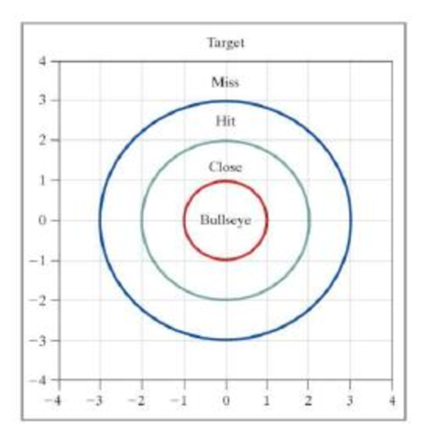
Your task is to write a function named Classify that returns a text string indicating where on the target the light pulse hit as well as a numeric score.
As shown on the graph, the text string should contain either “Bullseye,” “Close,” “Hit,” or “Miss.” If the player missed the screen altogether, the text string should contain “Total Miss.” If the coordinates sent to the function lie exactly on a boundary, it should be classified with the area farther from the center.
The numeric score should be set according to the following list:
| Bulseye: | 4 |
| Close: | 2 |
| Hit: | 1 |
| Miss: | 0 |
| Total Miss: | –1 |
Remember that a circle can be defined by
where R is the radius or the circle.
Want to see the full answer?
Check out a sample textbook solution
Chapter 18 Solutions
Thinking Like an Engineer: An Active Learning Approach (4th Edition)


- Suppose your CFD code can handle nonelementary blocks. Combine as many blocks of Fig. as you can. The only restriction is that in any one block, the number of i-intervals and the number of j-intervals must be constants. Show that you can create a structured grid with only three nonelementary blocks. Renumber all the blocks and indicate how many i- and j-intervals are contained in each block. Add up all the cells and verify that the total number of cells does not change.arrow_forwardYou are the mechatronics engineer of a manufacturing plant. You decide to perform an analysis on a robot arm of the assembly line with the objective of optimizing its performance. After taking several readings of the speed of the arm’s end effector, you approximate its velocity to the function given below. v(t) = -t4 + 5t3 - 7t2 + 3t + 0.22 0 =< t =< 3 where the velocity is in ms-1 Use your knowledge of differentiation to sketch the velocity-time graph, clearly marking the critical points. Using the graph sketched in (a) above, estimate the velocity when t = 1.5 s Calculate the velocity of the function when t = 1.5 s by substituting to the velocity function. Compare this value to the value you estimated in b above.arrow_forwardI am having trouble with this computer aided engineering problem in Matlab. A two-inch diameter craft ball is thrown vertically. The initial velocity of the ball is 20 ft/s. Neglecting drag, draw a free body diagram and formulate a first order ODE that governs the velocity of the ball. Is the ODE linear or non-linear? Use Euler’s first order method to determine the “drag free” time required to achieve maximum elevation. Check your solution with the analytic solution to the ODE that governs the motion of the ball. Drag force is known to be proportional to the velocity squared. Draw a free body diagram and formulate a first order ODE that governs the actual velocity of the ball. Is the ODE linear or non-linear? To determine the drag coefficient effect, an experiment has been conducted that showed the terminal velocity of the ball (during a free fall) to be 20 ft/s. Use Euler’s method to estimate the “actual” time to achieve maximum elevation for the case that the…arrow_forward
- USE MATLAB (Convolutional Code) The vector representation of a convolutional code is g1=[1 1]and g2=[1 0]. If the received sequence is 11 11 01 10, please use Viterbi Algorithm todecode it. Please show the full trellis diagram, including the updated trellis statemetrics.arrow_forwardAs4. This is my third time asking this question. Please DO NOT copy and paste someone else's work or some random notes. I need an answer to this question. There is a mass attached to a spring which is fixed against a wall. The spring is compressed and then released. Friction and is neglected. The velocity and displacement of the mass need to be modeled with an equation or set of equations so that various masses and spring constants can be input into Matlab and their motion can be observed. Motion after being released is only important, the spring being compressed is not important. This could be solved with dynamics, Matlab, there are multiple approaches.arrow_forwardUSE MATLAB AND SOLVE THIS QUESTION The ideal gas law relates the pressure P, volume V, absolute temperature T, and amount of gas n. The law is P = nRT/ V where R is the gas constant. An engineer must design a large natural gas storage tank to be expandable to maintain the pressure constant at 2.2 atm. In December when the temperature is 4°F (- 15°C), the volume of gas in the tank is 28 500 ft3 . What will the volume of the same quantity of gas be in July when the temperature is 88°F (31°C)? (Hint: Use the fact that n, R, and P are constant in this problem. Note also that K =°C +273.2.)arrow_forward
- MATLAB: Use a built-in MATLAB function to generate position vs. time data and plot the position of the vehicle with time for the entire journey. .arrow_forwardWe have designed a divide-and-conquer algorithm that runs on an input of size n. This algorithm works by spending O(1) time splitting the problem in half, then does a recursive call on each half, then spends O(n2 ) time combining the solutions to the recursive calls. On small inputs, the algorithm takes a constant amount of time. We want to see how long this algorithm takes, in terms of n to perform the task. (a) First, write a recurrence relation that corresponds to the time-complexity of the above divide and conquer algorithm. (b) Then, solve the relation to come with the worst-case time taken for the algorithm. Please show all work in depth.arrow_forwardPlease provide the correct matlab code for the following question.arrow_forward
- Make a graph of x versus t for the ball. Because you havedata only at certain instants of time, your graph should consist of dots that are not connected together.arrow_forwardPlease include a kinamatic diagram (one for velocity and one for acceleration). Please DO NOT solve this using velocity analysis (cartesian vector analysis i j k). I would like it to be solved using the IC scalar method as requested in the picture for the question. Thank you for your understanding. If you can solve it as soon as possible that would be great and I will give you a thumps up and positive feedback :)arrow_forwardSuppose that the total cost function for an is linear, that the marginal cost is $54, and that the total cost for 50 players is $8700. Write the equation of this MP3 player cost function and then graph it.arrow_forward
 Elements Of ElectromagneticsMechanical EngineeringISBN:9780190698614Author:Sadiku, Matthew N. O.Publisher:Oxford University Press
 Mechanics of Materials (10th Edition)Mechanical EngineeringISBN:9780134319650Author:Russell C. HibbelerPublisher:PEARSON
 Thermodynamics: An Engineering ApproachMechanical EngineeringISBN:9781259822674Author:Yunus A. Cengel Dr., Michael A. BolesPublisher:McGraw-Hill Education
 Control Systems EngineeringMechanical EngineeringISBN:9781118170519Author:Norman S. NisePublisher:WILEY
 Mechanics of Materials (MindTap Course List)Mechanical EngineeringISBN:9781337093347Author:Barry J. Goodno, James M. GerePublisher:Cengage Learning
 Engineering Mechanics: StaticsMechanical EngineeringISBN:9781118807330Author:James L. Meriam, L. G. Kraige, J. N. BoltonPublisher:WILEY