
Concept explainers
Videos
A phase diagram for carbon and platinum is shown. It is assumed the lines shown are linear, and the mixture has the following characteristics. The endpoints of the division line between these two phases are labeled on the diagram.
■ Below 1700 degrees Celsius, it is a mixture of solid platinum (Pt) and graphite (G).
■ Above 1700 degrees Celsius, there are two possible phases: a Liquid (L) phase and a Liquid (L) + phase (G).
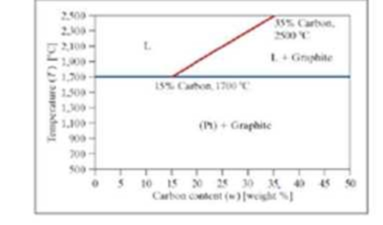
Write a program to determine the phase. The program should ask the user to enter the weight percent carbon and the temperature in degrees Celsius. Call the phases “Pt + G,” “L,” and “L + G,” for simplicity. If the point falls directly on the T = 1700°C line, include the point in the “Pt + G” phase. If the point falls directly on the L, L + Gline, include the point in the “L + G” phase.
Store the phase as text in a variable. The equation of the line dividing the L and L + G phases must be found in the program using polyfit. The program should produce a formatted output statement to the command window. Similar to “For X.XX weight percent carbon and a temperature of YYY degrees Celsius, the phase is PHASE” where x.xx, yyy and PHASE are replaced by the actual values formatted as shown.
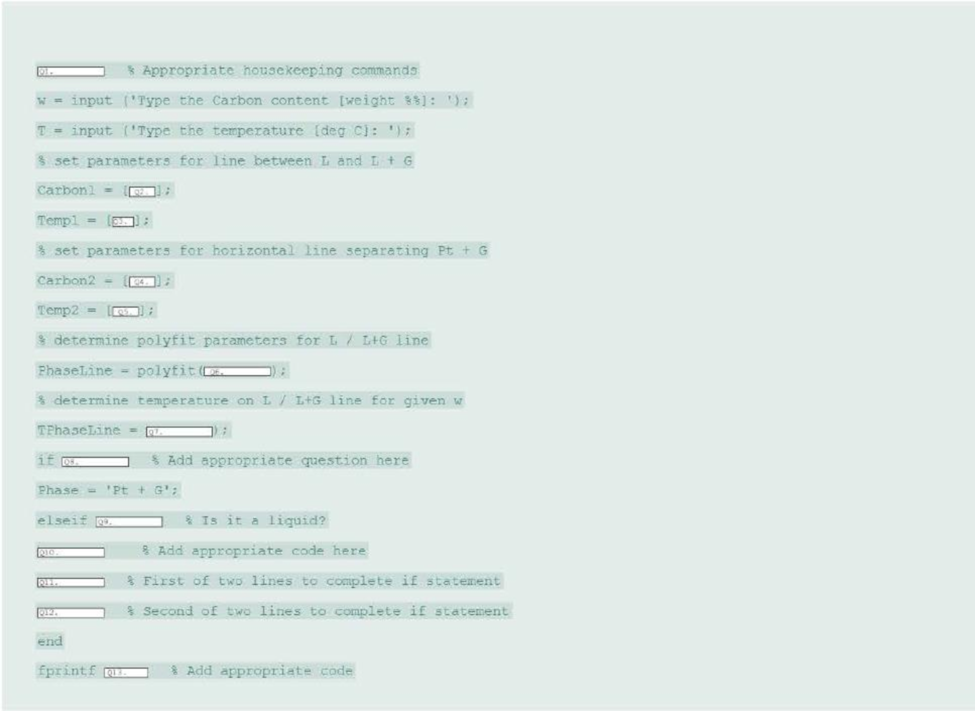
The following partial code is designed to implement this program. You are to fill in the missing sections of code as appropriate to complete the program.
Want to see the full answer?
Check out a sample textbook solution
Chapter 18 Solutions
Thinking Like an Engineer: An Active Learning Approach (4th Edition)


- 1. At ordinary room temperature, it was found that specific heat ratio ‘k’ of air was 1.40. Estimate the R, Cp and Cv of air assuming that air content is solely composed of 21% of Oxygen and the rest is Nitrogen. Draw a figure or FBD that will support the problem. Explain each step by step formula.arrow_forwardExercises: Sketch the phase diagram of a substance with the following points on the phase diagram: a triple point at 0.5 atm and 150 K; a normal melting point at 175 K; a normal boiling point at 350 K; and a critical point at 2.0 atm and 450 K. The solid liquid line is “normal” (meaning positive sloping). 1. Label the area 1, 2, and 3, and points T and C on the diagram. 2. Describe what one would see at pressures and temperatures above 2.0 atm and 450 K. 3. Describe the phase changes from 50 K to 250 K at 1.5 atm. 4. What exists in a system that is at 1 atm and 350 K? 5. What exists in a system that is at 1 atm and 175 K? Sketch the cooling curve of a substance with the following points: (A) 85 OC and 0 min, (B) 60 OC and 2 min, (C) 60 OC and 5 min, (D) 20 OC and 8 min, and (E) 20 OC and 11 min. Label each line 1, 2, 3, and 4 and each point A, B, C, D, and E. 1. What phase(s) exist at each of the numbered sections? 2. At what…arrow_forward1. Visualize a substance with the following points on the phase diagram: a triplepoint at 0.05 atm and 150 K; a normal melting point at 175 K; a normal boiling pointat 350 K; and a critical point at 2.0 atm and 450 K. The solid liquid line is “normal”(meaning positive sloping). For this, complete the following:a. Roughly sketch the phase diagram, using units of atmosphere and Kelvin. Labelthe area 1, 2, and 3, and points T and C on the diagram.b. Describe what one would see at pressures and temperatures above 2.0 atmand 450 K.c. Describe the phase changes from 50 K to 250 K at 1.5 atm.d. What exists in a system that is at 1 atm and 350 K?e. What exists in a system that is at 1 atm and 175 K?2. Based from the phase diagrams of water and carbon dioxide, answer thefollowing questions and justify your answers: 1. You have ice at 263 K (-10.0 oC)and 1.0 atm. What could you do to make the ice sublime? 2. A sample of dry ice(solid CO2) is cooled to 173 K (-100.0 oC), and is set on a table at…arrow_forward
- As a future engineer, give a sample situation where Duhem’s Theorem can be applied in the industry. Enumerate all possible variables that must be specified to fully determine the intensive and extensive states of the system. Also, enumerate possible changes that would affect the intensive and extensive coordinates. 1. Describe the system. What are the phases and components present in the system?2. What are the extensive and intensive variables to completely determine the equilibrium state of the system?arrow_forwardFor the metals A and B, which are given below, create the hypothetical phase diagram between 500 ° C and 900 ° C temperatures.Ø A metal has a melting temperature of 840 ° C.The solubility of Ø B in A can be ignored at all temperatures.Ø Melting temperature of Metal B is 730 ° C.The maximum solubility of A in Ø B is 10% A by weight, which occurs at 600 ° C.At 500 ° C, the solubility of A in B is 6% A by weight.Ø An eutectic 600 ° C and 74% B by weight - 26% by weight A are formed.Ø The second eutectic occurs at 630 ° C and 59% B - 41% A by weight.Ø A third eutectic occurs at 655 ° C and 39% B - 61% A by weight.Ø A congress melting point is formed at 680 ° C and 52% B - 48% A by weight.Ø A second congress melting point is formed at 655 ° C and 66% B - 34% A by weight.Ø Intermetallic compound AB is present at 52 wt% B - 48 wt% A.Ø Intermetallic compound AB2 is present at 66 wt% B to 34 wt% A.arrow_forward100 grams of water are mixed with 200 grams of another fluid (specific density=790 kg/m3), what is the specific volume of the resulting mixture, assuming the volumes are additive and the mixture is homogenous?arrow_forward
- How do you call in binary phase diagram, the line which is described as the locus of all system that represent the boundary between a single liquid phase and the two phases? Liquidus Eutectic point Critical point Triple pointarrow_forwardA) Identify all congruent reactions and their coordinates in the phase diagramB) Identify all invariant reactions (reaction type and coordinates) in the phase diagramC) Starting from a liquid at 70 at.% Ni and 1800 degrees C, cool the liquid slowly such that thermodynamic equilibrium is always maintained.C1) At what temperature does solid first appear?C2) Identify the solid phase which appears first from the liquid state and its approximate compositionC3) At what temperature does the liquid finally disappear?C4) What is the liquid composition when it finally disappearsC5) Identify the last solid phase which appears during cooling and the temperature at which this last solid phase appearsC6) At the point where the last solid phase appears during cooling, identify the phases present, give their compositions, and calculate their fractionsarrow_forwardFrom the phase diagram. Describe and identify the following: a. Identify the physical form of the sample of water at 100 °C and 101.3 kPa. b. Describe the changes of the sample that occur when temperature slowly decreases from point where the conditions is at 374 °C and 100 kPa. c. Describe the changes of sample at constant temperature, the initial condition is at 0 °C and 100 kpa.arrow_forward
- For two hypotetical materials which have limitless solubility for both in the “liquid” and “solid” states in each other, the following data are listed. Melting Temperatures of material A and B are Tm,A and Tm,B respectively, Liquidus and Solidus curves are circular arcs. a- Draw the related “Phase Diagram” of Material A and Material B showing the data given and calculated. b- Calculate/Determine the compositions of phases at T2 , explain the procedure. c- Calculate/Determine the “percentages” of “phases” of Alloy,2 at T2 , explain the procedure. Given: -Tm,A, Celcius =530 -Tm,B, Celcius =830 -T1, Celcius =630 -B percentage of Liquid phase at T1 =35 -B percentage of Solid phase at T1 =80 -B percentage of Alloy 2. =60 -T2, Celcius =680 -B percentage of Liquid phase of Alloy 2 at T2 = to be calculated -B percentage of Solid phase of Alloy 2 at T2 = to be calculatedarrow_forwardIf a certain system has one component, at what number of phases will the formula of degrees of freedom starts to become invalid?arrow_forwardQUESTION1 1.1 Name and explain three forms of density ?1.2 A mixture of two liquids of equal volume is made; the one has a relative density of 0.8 and the other a density of 980 kg/m3. What will be the weight of 2 500 liters?arrow_forward
 Elements Of ElectromagneticsMechanical EngineeringISBN:9780190698614Author:Sadiku, Matthew N. O.Publisher:Oxford University Press
 Mechanics of Materials (10th Edition)Mechanical EngineeringISBN:9780134319650Author:Russell C. HibbelerPublisher:PEARSON
 Thermodynamics: An Engineering ApproachMechanical EngineeringISBN:9781259822674Author:Yunus A. Cengel Dr., Michael A. BolesPublisher:McGraw-Hill Education
 Control Systems EngineeringMechanical EngineeringISBN:9781118170519Author:Norman S. NisePublisher:WILEY
 Mechanics of Materials (MindTap Course List)Mechanical EngineeringISBN:9781337093347Author:Barry J. Goodno, James M. GerePublisher:Cengage Learning
 Engineering Mechanics: StaticsMechanical EngineeringISBN:9781118807330Author:James L. Meriam, L. G. Kraige, J. N. BoltonPublisher:WILEY