
Subpart (a):
The
Subpart (a):
Explanation of Solution
The production possibility frontier for country Latvia is given in figure 1 as follows:
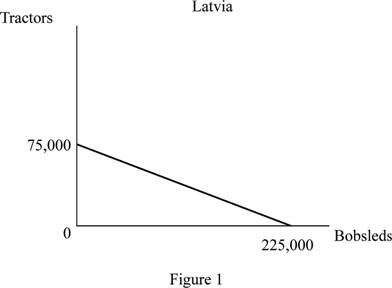
From figure 1, it can be inferred that if all the resources are employed in the production of tractors then, at most 75,000 tractors can be produced and if all resources are employed in the production of Bobsleds then. 225,000 bobsleds can be produced.
The production possibility frontier for country Estonia is given in figure 2 as follows:
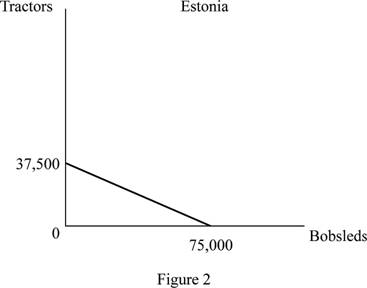
From figure 2, it can be inferred that if all the resources are employed in the production of tractors then, at most 37,500 tractors can be produced and if all resources are employed in the production of Bobsleds then. 75,000 bobsleds can be produced.
Concept Introduction:
Production possibilities frontier: It is a graph that shows the combinations of output that the economy can possibly produce the given available factors of production and the available production technology.
Subpart (b):
The
Subpart (b):
Explanation of Solution
The opportunity cost of producing Tractors for Latvia (OCLT) can be calculated as follows:
Thus, the opportunity cost for Latvia to produce one tractor is 3 bobsleds.
The opportunity cost of producing Tractors for Estonia (OCET) can be calculated as follows:
Thus, the opportunity cost for Estonia to produce one tractor is 2 bobsleds.
Since Estonia incurs a lower opportunity cost in the production of tractors then, Estonia has a comparative advantage in tractor production than Latvia.
The opportunity cost of producing Bobsleds for Latvia (OCLB) can be calculated as follows:
Thus, the opportunity cost for Latvia to produce one bobsled is 1/3 tractors.
The opportunity cost of producing Bobsleds for Estonia (OCEB) can be calculated as follows:
Thus, the opportunity cost for Estonia to produce one bobsled is 1/2 tractors.
Since Latvia incurs a lower opportunity cost in the production of bobsleds then, Latvia has a comparative advantage in bobsleds production than Estonia.
Since both have comparative advantages, they will definitely engage in the trade.
Concept Introduction:
Opportunity cost: The opportunity cost refers to the value of what one has to give up in order to choose another alternative.
Comparative advantage: It is the ability of a producer, firm or country to produce a good or service at a lower opportunity cost of production than the competitors.
Subpart (c):
The agreement of exchange.
Subpart (c):
Explanation of Solution
If a trade’s agreement is negotiated, any agreement between 2 bobsleds and 3 bobsleds per tractor will benefit both countries’ trade and specialization.
Want to see more full solutions like this?

- There are two countries Home and Foreign. Home has 1,200 units of labor available. It can produce two goods, apples and bananas. The unit labor requirement in apple production is 3, while in banana production it is 2. Foreign has a labor force of 800. Foreign's unit labor requirement in apple production is 5, while in banana production it is 1. Suppose world relative demand takes the following form: Demand for apples/demand for bananas = price of bananas/price of apples. 1.) Using the 3-point curved line drawing tool, draw the relative demand curve on the graph to the right. Label the curve RD. Now suppose that instead of 1,200 workers, Home had 2,400. The relative supply curve (RS) would shift to the right (as shown by RS₁). 2.) Using the point drawing tool, indicate the new equilibrium relative price of apples. Label this point EQ. Carefully follow the instructions above and only draw the required objects. What can you say about the efficiency of world production and the division of…arrow_forwardThere are two countries Home and Foreign. Home has 1,200 units of labor available. It can produce two goods, apples and bananas. The unit labor requirement in apple production is 3, while in banana production it is 2. Foreign has a labor force of 800. Foreign's unit labor requirement in apple production is 5, while in banana production it is 1. Suppose world relative demand takes the following form: Demand for apples/demand for bananas = price of bananas/price of apples a-b. On the graph to the right: 1.) Using the 3-point curved line drawing tool, draw the relative demand curve. Label the curve RD. 2) Using the point drawing tool, indicate the equilibrium relative price of apples. Label this point EQ. Carefully follow the instructions above and only draw the required objects. 2 Relative price of apples Pa/Pb 0 035 0.75 05 Relative quantity of apples RSarrow_forwardIn 2017, Nepal’s production of rice and machinery was published by the Nepal Bureau of Statistics (NBS) as indicated by the table below: Production in Nepal Position P Q R S T U V W X Y Z Rice (1000 tons) 0 10 26 37 45 50 55 59 66 77 80 Machinery (units) 90 89 85 80 75 70 65 60 50 30 0 Based on the table above, a production possibility frontier (PPF) for Nepal can be plotted as below: Use the NBS production table and production possibility frontier to answer the following questions: Name positions B, V and D. Also, as indicated in the table, supposing Nepal is operating at level T, what is the opportunity cost of producing 10,000 more tons of rice?arrow_forward
- If a country can produce more of a good than other countries with a given amount of resources, we say that country has the| [ Select ] and if a country has less to lose in producing a good than other countries do, we say that country has [ Select ]arrow_forwardIn 2017, Nepal’s production of rice and machinery was published by the Nepal Bureau of Statistics (NBS) as indicated by the table below: Production in Nepal Position P Q R S T U V W X Y Z Rice (1000 tons) 0 10 26 37 45 50 55 59 66 77 80 Machinery (units) 90 89 85 80 75 70 65 60 50 30 0 Based on the table above, a production possibility frontier (PPF) for Nepal can be plotted as below: Use the NBS production table and production possibility frontier to answer the following questions: Name positions B, V and D. Also, as indicated in the table, supposing Nepal is operating at level T, what is the opportunity cost of producing 10,000 more tons of rice? Use the graph below to answer the questions that follow:arrow_forwardIn 2017, Nepal’s production of rice and machinery was published by the Nepal Bureau of Statistics (NBS) as indicated by the table below: Production in Nepal Position P Q R S T U V W X Y Z Rice (1000 tons) 0 10 26 37 45 50 55 59 66 77 80 Machinery (units) 90 89 85 80 75 70 65 60 50 30 0 Based on the table above, a production possibility frontier (PPF) for Nepal can be plotted as below: Use the NBS production table and production possibility frontier to answer the following questions: Name positions B, V and D. Also, as indicated in the table, supposing Nepal is operating at level T, what is the opportunity cost of producing 10,000 more tons of rice? Use the graph below to answer the questions that follow: (I have sent the picture…arrow_forward
- In 2017, Nepal’s production of rice and machinery was published by the Nepal Bureau of Statistics (NBS) as indicated by the table below: Production in Nepal Position P Q R S T U V W X Y Z Rice (1000 tons) 0 10 26 37 45 50 55 59 66 77 80 Machinery (units) 90 89 85 80 75 70 65 60 50 30 0 Based on the table above, a production possibility frontier (PPF) for Nepal can be plotted as below: Use the NBS production table and production possibility frontier to answer the following questions: (A) Name positions B, V and D. Also, as indicated in the table, supposing Nepal is operating at level T, what is the opportunity cost of producing 10,000 more tons of rice? (B) Use the graph below to answer the questions that follow: B1: Suppose Nepal begins to manufacture fertilizers. Explain the impact of the discovery of fertilizers on Nepal’s economy…arrow_forwardIn 2017, Nepal’s production of rice and machinery was published by the Nepal Bureau of Statistics (NBS) as indicated by the table below: Production in Nepal Position P Q R S T U V W X Y Z Rice (1000 tons) 0 10 26 37 45 50 55 59 66 77 80 Machinery (units) 90 89 85 80 75 70 65 60 50 30 0 Based on the table above, a production possibility frontier (PPF) for Nepal can be plotted as below: Use the NBS production table and production possibility frontier to answer the following questions: Name positions B, V and D. Also, as indicated in the table, supposing Nepal is operating at level T, what is the opportunity cost of producing 10,000 more tons of rice? Use the graph below to answer the questions that follow: B1: Suppose Nepal…arrow_forwardIn 2017, Ecuador's biggest export was crude (unprocessed) petroleum, 63% of which it exported to the United States, and Ecuador's biggest import was refined (processed) petroleum, of which 70% was imported from the United States. What does this tell you about the countries' comparative advantages in extracting petroleum and refining petroleum? This information suggests that has a comparative advantage in refining petroleum, and the United States must I ntage in extracting petroleum. Ecuadorarrow_forward
- What is the cost ratio of capital goods to consumer goods in Germany? What is the cost ratio of capital goods to consumer goods in France? Solve for a terms of trade ratio that will be mutually beneficial for both nations so that they will want to engage in trade with one another.arrow_forwardCompute the ratio of exports to imports for 2020 for each category.arrow_forwardWhich of the following would increase exports in the United States? The United States purchases 500 silver necklaces from Mexico. The government of Mexico purchases 500 Ford F-150 pickup trucks from the United States. A Mexican citizen purchases 25 shares of stock in Ford Motor Company. The U.S. government donates $5 million to Mexico to help victims of drought in Mexico.arrow_forward

 Principles of Economics (12th Edition)EconomicsISBN:9780134078779Author:Karl E. Case, Ray C. Fair, Sharon E. OsterPublisher:PEARSON
 Engineering Economy (17th Edition)EconomicsISBN:9780134870069Author:William G. Sullivan, Elin M. Wicks, C. Patrick KoellingPublisher:PEARSON
 Principles of Economics (MindTap Course List)EconomicsISBN:9781305585126Author:N. Gregory MankiwPublisher:Cengage Learning
 Managerial Economics: A Problem Solving ApproachEconomicsISBN:9781337106665Author:Luke M. Froeb, Brian T. McCann, Michael R. Ward, Mike ShorPublisher:Cengage Learning
 Managerial Economics & Business Strategy (Mcgraw-...EconomicsISBN:9781259290619Author:Michael Baye, Jeff PrincePublisher:McGraw-Hill Education