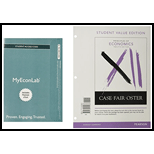
Principles Of Economics, Student Value Edition Plus Mylab Economics With Pearson Etext -- Access Card Package (12th Edition)
12th Edition
ISBN: 9780134419381
Author: CASE
Publisher: PEARSON
expand_more
expand_more
format_list_bulleted
Question
Chapter 18, Problem 6.1P
To determine
Identify the role of poverty line in different residents.
Expert Solution & Answer
Want to see the full answer?
Check out a sample textbook solution
Students have asked these similar questions
The following table summarizes the income distribution for the town of Perkopia, which has a population of 10,000 people. Every individual within an income group earns the same income, and the total annual income in the economy is $500,000,000. Suppose that in 2007, the poverty line is set at an annual income of $12,700 for an individual.
Year
Share of Total Income in Perkopia
(Percent)
Lowest Quintile
Second Quintile
Middle Quintile
Fourth Quintile
Highest Quintile
2001
3.0
8.1
14.0
21.5
53.4
2007
3.4
9.0
14.8
22.0
50.8
2013
3.8
9.5
15.4
22.7
48.6
2019
4.0
10.0
16.5
24.0
45.5
The data in the table suggest that there was___________ income inequality from 2001 to 2019.
Complete the following table to help you determine the poverty rate in Perkopia in 2007. To do this, begin by determining the total income of all individuals in each quintile using the fact that total annual income in the economy is $500,000,000. Next, determine the…
The following table summarizes the income distribution for the town of Perkopia, which has a population of 10,000 people. Every individual within an income group earns the same income, and the total annual income in the economy is $500,000,000. Suppose that in 2016, the poverty income threshold, or poverty line, is set at an annual income of $43,275 for an individual.
Year
Share of Total Income in Perkopia
(Percent)
Lowest Quintile
Second Quintile
Middle Quintile
Fourth Quintile
Highest Quintile
2006
3.0
7.6
14.0
21.7
53.7
2010
3.3
9.0
14.7
22.4
50.6
2016
3.9
9.5
15.0
22.7
48.9
2020
5.0
10.0
16.0
24.0
45.0
The data in the table suggest that there was income inequality from 2006 to 2020.
Complete the following table to help you determine the poverty line in Perkopia in 2016. To do this, begin by determining the total income of all individuals in each quintile, using the fact that total annual income in the economy is $500,000,000.…
Use the following information to calculate poverty rates for the following two countries, Woolandia and Narnia. Set the poverty line to $365.
What is the Poverty Gap Index for each country?
What does this measure tell you that is different from the headcount index?
Chapter 18 Solutions
Principles Of Economics, Student Value Edition Plus Mylab Economics With Pearson Etext -- Access Card Package (12th Edition)
Knowledge Booster
Similar questions
Recommended textbooks for you


 Economics: Private and Public Choice (MindTap Cou...EconomicsISBN:9781305506725Author:James D. Gwartney, Richard L. Stroup, Russell S. Sobel, David A. MacphersonPublisher:Cengage Learning
 Microeconomics: Private and Public Choice (MindTa...EconomicsISBN:9781305506893Author:James D. Gwartney, Richard L. Stroup, Russell S. Sobel, David A. MacphersonPublisher:Cengage Learning
 Survey of Economics (MindTap Course List)EconomicsISBN:9781305260948Author:Irvin B. TuckerPublisher:Cengage Learning


Economics: Private and Public Choice (MindTap Cou...
Economics
ISBN:9781305506725
Author:James D. Gwartney, Richard L. Stroup, Russell S. Sobel, David A. Macpherson
Publisher:Cengage Learning

Microeconomics: Private and Public Choice (MindTa...
Economics
ISBN:9781305506893
Author:James D. Gwartney, Richard L. Stroup, Russell S. Sobel, David A. Macpherson
Publisher:Cengage Learning

Survey of Economics (MindTap Course List)
Economics
ISBN:9781305260948
Author:Irvin B. Tucker
Publisher:Cengage Learning