
Concept explainers
Videos
Construct amplitude and phase line spectra for Prob. 19.4.
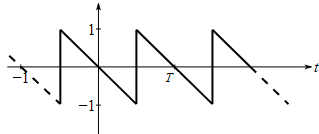
To graph: The amplitude and phase line spectra for the sawtooth wave as shown in the following figure,
Explanation of Solution
Given Information: The sawtooth wave given in the following figure,
Formula used:
Consider
then the Fourier series expansion of the function,
And the coefficients are defined by,
Alternatively, the Fourier series can also be written as,
Here, the amplitude
Plot
Graph:
Consider the sawtooth wave given in the following figure,
Therefore, the sawtooth wave is a periodic function
Therefore, the sawtooth wave,
Therefore, the Fourier series expansion of this function is,
In the above expression, the coefficients are defined by,
Now, find
Consider,
Hence,
Further,
Therefore,
Now, find
Consider,
Hence,
Further,
Thus,
Hence, the coefficients of the Fourier series expansions are,
That is,
Consider,
Thus, the amplitude of the
Furthermore, consider,
As
As
Therefore,
Thus, the phases corresponding to
Use the following MATLAB code to construct the amplitude plot.
Execute the above code to obtain the amplitude plot as,
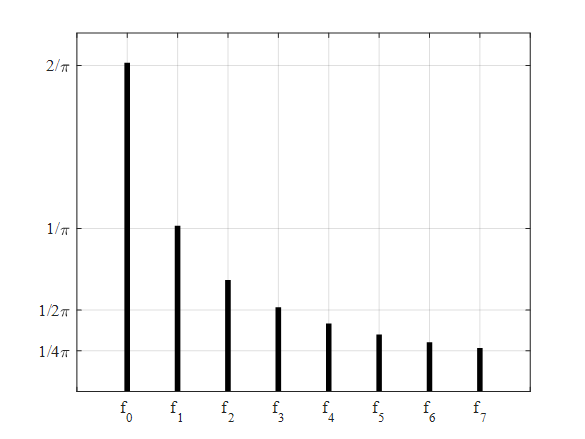
Interpretation: The above plot shows the amplitude plot for the sawtooth wave as shown in the figure provided.
Use the following MATLAB file can be used to construct the phase plot.
Execute the above code to obtain the plot as,
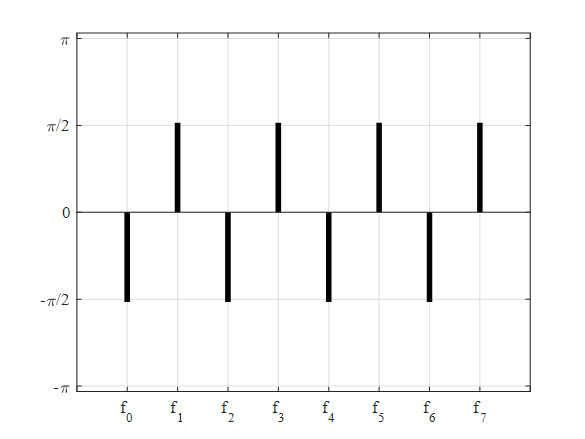
Interpretation: The above plot shows the phase line spectra for the sawtooth wave as shown in the figure provided.
Want to see more full solutions like this?
Chapter 19 Solutions
Numerical Methods For Engineers, 7 Ed


- 4.1.59 Pure sounds produce single sine waves on an oscilloscope. Find the amplitude and period of the sine wave graph. On the vertical scale, each square represents 5; on the Ay horizontal scale, each square represents 30 or X. The amplitude is (Simplify your answer. Type an exact answer, using n as needed. Use integers or fractions for any numbers in the expression.) Enter your answer in the answer box and then click Check Answer. Clear All 1. 1 part remainingarrow_forward(a) Use a graphing utility to draw a scatter diagram for the data of one period. Which screen is correct? [0,13] by [0,60].) A. A scatter diagram has a horizontal axis labeled from 0 to 13 in increments of 1 and a vertical axis labeled from 0 to 60 in increments of 10. The (All screens are following points are plotted: (1, 26); (2, 32); (3, 43); (4, 49); (5, 54); (6, 54); (7, 49); (8, 43); (9, 34); (10, 26); (11, 21); (12, 16). All coordinates are approximate. (a) Use a graphing utility to draw a scatter diagram for the data of one period. Which screen is correct? (All screens are [0,13] by [0,60]. 2.6.27-GC The following data represent the average monthly temperatures in "F) for a city in Alaska. Jaruary, 1 24.6 Apri, 4 40.1 July. 7 Fobruary, 2 29.0 May, 5 47.5 August, 8 586 October, 10 42.6 556 Novomber, 11 32.5 333 June, 6 534 Arswer the folowing questions March, 3 September, 9 49s December, 12 27.5 (a) Usa a graphing ulility to draw a scatter diagram far the data of ane pariad…arrow_forwardEvaluate. sin COS %3D 6. ±= [Select] a = [ Select ] rt b = [Select ]arrow_forward
- 10.1.23 Plot the given graph by finding the values of y that correspond to the values of x of 0, 1, 2, 3, 4, 5, 6, and 7 on a calculator. (Remember, the numbers 0, 1, 2, and so on represent radian measure.) y = - 4 sin x |0 | 1 | 2 3 | 4 | 5 | 6 汁 7 y (Type integers or decimals rounded to the nearest tenth as needed.)arrow_forward3. 4. 5. 2. Determine the general value of the following. tan(2-5j) cosh (.458 +0.567j) arccot()arrow_forwardthat proke lose chie %3D Let us Considerarrow_forward
- The population P (in thousands) of a certain city from 2000 through 2014 can be modeled by P = 140.5ekt,arrow_forwardIllustration 15.11. Twenty-five pairs of values of variate x and y led to the following results. N= 25, Ex = 127, Ey = 100, Ex = 760, Ey² = 449 and Exy = 500. A subsequent scrutiny showed that two pairs of values were copied down as x|y whereas the correct values where x 8 14 8 12 8. 6. 6. 8. obtain the correct value of coefficient.arrow_forward18 Which graph represents the graph of the function, f (x) = 4 cos 0 ?arrow_forward
 Trigonometry (MindTap Course List)TrigonometryISBN:9781337278461Author:Ron LarsonPublisher:Cengage Learning
 Algebra & Trigonometry with Analytic GeometryAlgebraISBN:9781133382119Author:SwokowskiPublisher:Cengage
 Algebra: Structure And Method, Book 1AlgebraISBN:9780395977224Author:Richard G. Brown, Mary P. Dolciani, Robert H. Sorgenfrey, William L. ColePublisher:McDougal Littell
 Mathematics For Machine TechnologyAdvanced MathISBN:9781337798310Author:Peterson, John.Publisher:Cengage Learning,