
PRIN.OF GEOTECHNICAL...-MINDTAP(2 SEM)
9th Edition
ISBN: 9781305971271
Author: Das
Publisher: CENGAGE L
expand_more
expand_more
format_list_bulleted
Concept explainers
Videos
Textbook Question
Chapter 2, Problem 2.2CTP
Refer to Problem 2.C.1. Results of the sieve analysis for Soils A, B, and C are given below. To obtain a more representative sample for further geotechnical testing, a ternary blend is created by uniformly mixing 8000 kg of each soil. Answer the following questions.
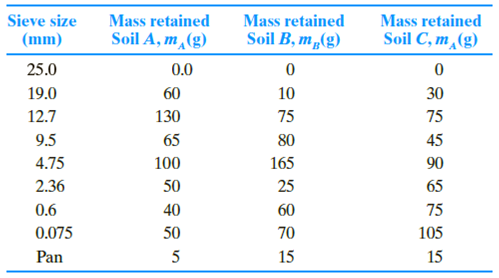
a. If a sieve analysis is conducted on the mixture using the same set of sieves as shown above, compute the mass retained (as a percentage) and cumulative percent passing in each sieve.
b. What would be the uniformity coefficient (Cu) and the coefficient of gradation (Cc) of the mixture?
Expert Solution & Answer

Trending nowThis is a popular solution!

Students have asked these similar questions
The results of a sieve analysis are reported in table 1. The total weight of the sample was
500 g. Plot the gradation curve, calculate CU and Cz, and use these coefficients the
determine whether the soil is well graded or poorly graded.
Table 1. Results of the sieve analysis
Sieve size
Weight retained (g)
# 4
#10
14.8
#20
98
# 40
90.1
#100
181.9
# 200
108.8
Pan
6.1
Q3
The results of a particle size analysis of a soil are given in the following
Table. No Atterberg limit tests were conducted.
Sieve No.
Percent finer
No.40 No.100 | No.200
49.8
No.4
No.10 No.20
70.2
62.5
9.53 mm
100
89.8
28.6
4.1
a) Would you have conducted Atterberg limit tests on this soil? Justify your
answer.
b) Classify the soil according to USCS and AASHTO.
c) Is this soil a good foundation material? Justify your answer
Q.2 Results of sieve analysis are shown in the table below. Check whether this soil can be classified as
SP or not?
100
90
60
30
10
3.
Finer (%)
No. 200
No. 4
3 mm
0.42 mm
0.25
(0.075
*Sieve
12.5 mm
(4.7 mm)
mm)
Chapter 2 Solutions
PRIN.OF GEOTECHNICAL...-MINDTAP(2 SEM)
Ch. 2 - For a gravel with D60 = 0.48 mm, D30 = 0.25 mm,...Ch. 2 - Prob. 2.2PCh. 2 - Prob. 2.3PCh. 2 - The following are the results of a sieve analysis....Ch. 2 - Repeat Problem 2.4 with the following data. 2.4...Ch. 2 - Repeat Problem 2.4 with the following data. 2.4...Ch. 2 - Repeat Problem 2.4 with the following data. 2.4...Ch. 2 - The following are the results of a sieve and...Ch. 2 - Repeat Problem 2.8 using the following data. 2.8...Ch. 2 - Repeat Problem 2.8 using the following data. 2.8...
Ch. 2 - The grain-size characteristics of a soil are given...Ch. 2 - Repeat Problem 2.11 with the following data. 2.11...Ch. 2 - Repeat Problem 2.11 with the following data. 2.11...Ch. 2 - A hydrometer test has the following result: Gs =...Ch. 2 - Repeat Problem 2.14 with the following values: Gs...Ch. 2 - Three groups of students from the Geotechnical...Ch. 2 - Refer to Problem 2.C.1. Results of the sieve...
Knowledge Booster


Learn more about
Need a deep-dive on the concept behind this application? Look no further. Learn more about this topic, civil-engineering and related others by exploring similar questions and additional content below.Similar questions
- Repeat Problem 2.4 with the following data. 2.4 The following are the results of a sieve analysis. a. Determine the percent finer than each sieve and plot a grain-size distribution curve. b. Determine D10, D30, and D60 for each soil. c. Calculate the uniformity coefficient Cu. d. Calculate the coefficient of gradation Cc.arrow_forwardRepeat Problem 2.8 using the following data. 2.8 The following are the results of a sieve and hydrometer analysis. a. Draw the grain-size distribution curve. b. Determine the percentages of gravel, sand, silt and clay according to the MIT system. c. Repeat Part b according to the USDA system. d. Repeat Part b according to the AASHTO system.arrow_forwardThe results of the particle-size analysis of the soil are as follows: Percent passing No. 10 sieve = 100; Percent passing No. 40 sieve = 80; Percent passing No. 10 sieve = 58.The LL and PI of minus No. 40 fraction of the soil are 30 and 10 respectively. Classify the soil by USCS system a. CH b. SP-SC c. CL-ML d. CL-MLarrow_forward
- 7. Following details regarding the particle size distribution and other index properties pertinent to the classification of soil. Choose three soils and classify each soil according to USCS and AASHTO classification systems. When necessary, assume Cu = 4.48 and C = 1.22. Your solution may be presented in similar form as what was included in your module 4. Sieve Analysis (Percent Finer) Soil No Liquid Limit Plastic Limit No. 10 No. 40 No. 200 1 98 80 50 38 29 2 100 92 80 56 23 3 100 88 65 37 22 4 85 55 45 28 20 5 92 75 62 43 28 6 48 28 6 N.A. NP 7 87 62 30 32 24 8 90 76 34 37 25 9 100 78 8 N.A. NP 10 92 74 32 44 35arrow_forwardMechanical analysis on four different samples designated as A, B, C and D were carried out in a soil laboratory. The results of tests are given below. Hydrometer analysis was carried out on samples C and D. Sample C: liquid limit = 27%, plastic limit = 11%, Sample D: liquid limit = 70%, plastic limit = 38%, Classify the soils per the Unified Soil Classification System. Samples Sieve 75 mm 20.0 mm 4.75 mm 2.0 mm 600 μ 212 μ 75 μ 20 μ 6 μ 2μ A 100 64 39 24 12 5 1 Sample A B C B D10 0.47 0.23 0.004 с Percentage finer than 100 98 90 9 2 D30 3.0 0.3 0.036 93 76 65 59 54 47 34 23 7 4 D60 20 0.41 2.4 D 100 95 69 46 31arrow_forward200 pan 44 22arrow_forward
- For the two systems shown below (not to scale), the following are given. • Ah is the same for both systems. • The length of k₂ soil is twice the length of k₁ soil. • The cross-sectional areas of the soil samples are the same. • k₂= 2k₁ (Permeabilities) • q₁ = 100 cm³/hour Find q2 9₁ Ah 921 k k₂arrow_forwardASAParrow_forwardQUESTION 2 a. The results given in Table 1 were obtained in a particle size distribution test for soil sample received in the laboratory. Table 1 US Sieve No. Size Opening(mm) Weight Retained(g) 4 4.75 0 10 2.0 18.5 20 0.85 53.2 40 0.425 90.5 60 0.25 81.8 100 0.150 92.2 200 0.075 58.5 Pan - 26.5i. Determine the percentage passing each sieve and plot the particle size distribution curve. ii. How much fine-grained soils are in the sample ? iii. Determine the amount of gravel and sand in the sample ? iv. Determine D10, D30, and D60 from the grain-size distribution curve. v. Calculate the uniformity coefficient, Cu. vi. Calculate the coefficient of gradation, Cc. vii. Describe the gradation curve (eg poorly graded)arrow_forward
- Given below is the result of a sieve analysis done on a soil sample. Determine the value of the coefficient of uniformity. Round off th three decimal places.arrow_forwardA sample of soil was tested in the laboratory, and the test results were listed as follows. Classify the soil by both the AASHTO and the USCS. - LL = 29%, PL = 19% Sieve Size 1 in 3/4 in 3/8 in #4 #10 #40 #200 Percent Passing 100 90 82 70 65 54 25arrow_forwardConsider the grain size gradation curve for the soil shown in the image below and classify the soil according to the USCS. Notice the sieve names/sizes given. This soil is inorganic. Any fines present are non-plastic (say PI=0). Estimate values on log scale if necessary.arrow_forward
arrow_back_ios
SEE MORE QUESTIONS
arrow_forward_ios
Recommended textbooks for you
 Principles of Geotechnical Engineering (MindTap C...Civil EngineeringISBN:9781305970939Author:Braja M. Das, Khaled SobhanPublisher:Cengage Learning
Principles of Geotechnical Engineering (MindTap C...
Civil Engineering
ISBN:9781305970939
Author:Braja M. Das, Khaled Sobhan
Publisher:Cengage Learning
How Are Highways Designed?; Author: Practical Engineering;https://www.youtube.com/watch?v=9XIjqdk69O4;License: Standard Youtube License