Concept explainers
Videos
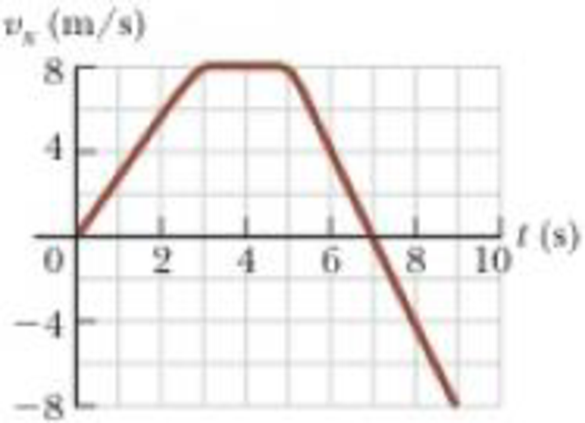
A student drives a moped along a straight road as described by the velocity–time graph in Figure P2.32. Sketch this graph in the middle of a sheet of graph paper. (a) Directly above your graph, sketch a graph of the position versus time, aligning the time coordinates of the two graphs. (b) Sketch a graph of the acceleration versus time directly below the velocity–time graph, again aligning the time coordinates. On each graph, show the numerical values of x and ax for all points of inflection. (c) What is the acceleration at t = 6.00 s? (d) Find the position (relative to the starting point) at t = 6.00 s. (e) What is the moped’s final position at t = 9.00 s?
Figure P2.32

Trending nowThis is a popular solution!

Chapter 2 Solutions
Bundle: Physics for Scientists and Engineers with Modern Physics, Loose-leaf Version, 9th + WebAssign Printed Access Card, Multi-Term


- Clarissa is running at 5m/s to catch the school bus, which is stopped to a nearby bus stop. When Clarissa is still 40 meters away from the bus, the bus is already moving with a constant acceleration of 0.170 m/s2 . A. Compute the time and the distance does Clarissa have to run before she can overtake the bus. B. At the instant she reaches the bus, how fast is the bus moving?arrow_forwardWhile running a marathon, a long-distance runner uses a stopwatch to time herself over a distance of 100 m. She finds that she runs this distance in 18 s. Answer the following by considering ratios, without computing her velocity.a. If she maintains her speed, how much time will it take her to run the next 400 m?b. How long will it take her to run a mile at this speed?arrow_forwardWhile running a marathon, a long-distance runner uses a stopwatch to time herself over a distance of 100 m. She finds that she runs this distance in 18 s. Answer the following by considering ratios, without computing her velocity. a. If she maintains her speed, how much time will it take her to run the next 400 m?arrow_forward
- I am doing a lab report for my physics class. The lab consists of throwing a ball upward and recording its movements. Please explain these next questions and how you got the answer. The graphs attached below are my data for the ball in the x and y direction. From the velocity vs. time graph(s), determine the ball's acceleration independently for each component of the motion as a function of time. What is the ball's acceleration just after it is thrown and just before it is caught or lands? What is the magnitude of the ball’s acceleration at its highest point? Is this value reasonable?arrow_forwardCaravan Analogy.Consider a highway that has tollbooths every 120 km. Suppose that cars travel at a rate of 120 km/hr (cars have instant acceleration to 120 km/hr and maintain that constant speed between tollbooths). If there is a convoy of 22 cars, and it takes each car an average of 24 seconds to clear the tollbooth, calculate the following. a. Suppose the caravan travels 360 km, beginning in front of one tollbooth, passing through a second and third tollbooth and finishing just after a fourth tollbooth. What is the end-to-end delay, in minutes, from the time the first car goes through tollbooth 1 until the last cargoes through tollbooth 4? b.The cast members of “The Fast and the Furious” show up. Instead of 22 cars, there arenow 18 cars. These 18 cars travel 220 km/hr instead of 120 km/hr. What is the new end-to-end delay in minutes? c. Consider the diagram below. The police are on to the cast of “The Fast and the Furious”. These 18 cars travel 280 km/hr on segments A and B (where…arrow_forwardConcept Simulation 2.3 offers a useful review of the concepts central to this problem. An astronaut on a distant planet wants to determine its acceleration due to gravity. The astronaut throws a rock straight up with a velocity of +12.9 m/s and measures a time of 24.8 s before the rock returns to his hand. What is the acceleration (magnitude and direction) due to gravity on this planet? (positive = up, negative = down) Number -48.2 Units m/s^2arrow_forward
- Sketch a position vs time graph, a velocity vs time graph, and an acceleration vs time graph for the situation described below. At time t = 0 you are walking in the positive x direction with a constant speed of 1 m/s. You maintain that speed for 6 s. Then, you decrease your speed uniformly to 0 over a 2 s interval. You rest for 2 s, then turn around and increase your speed uniformly to 2 m/s in 4 s. You continue at that speed until you return to the starting place.arrow_forwardThe acceleration of an object increases linearly from 4 fps? to 12 fps? in 9 seconds. By the end of 9 seconds, the velocity is 48 fps. NOTE: At the start, the object is at the zero-reference point of displacement. a. Draw the a-t graph. Find the equation of the acceleration as the function of time. b. Draw the v-t graph. Find the equation of the velocity as the function of time. C. Draw the s-t graph. Find the equation of the displacement as the function of time.arrow_forwardA stone is thrown vertically upward from the top of a building. If the equation of the motion of the stone is s=-5t^2+30t+200, where s is the directed distance from the ground in meters and t is in seconds. a. At what time will be the stone hit the ground? Please answer the question in letter a.arrow_forward
- At t = 0, a truck is traveling east at a constant speed of s = 85.9 km/h. At an intersection d = 37.8 km ahead, a car is traveling north at constant speed of v = 58 km/h a.) Write an expression for the distance r between the truck and the car as a function of time. Use the variables from the problem statement for your equation. b.)Write an expression for the time at which the distance between the car and the truck as its minimum value. Use the variables from the problem statement for your equation. c.)What is the time, in hours, at which the distance between the car and the truck as its minimum value? d.) What is the minimum distance, in kilometers, between the car and the truck?arrow_forwardLet's Apply Part I. Using the table below, make an acceleration vs. time graph and find its slope in a graphing paper. time (s) 2 4 10 12 14 16 18 20 acceleration (m/s) 4 12 16 20 24 28 32 36 40 Part II. From the acceleration vs. time graph that you have made in part 1, find the velocity for the time interval. 8s > t>14 s.arrow_forwardSituation 02. Clarissa is running at 5 m/s to catch the school bus, which is stopped to a nearby bus stop. When Clarissa is still 40 meters away from the bus, the bus is already moving with a constant acceleration of 0.170 m/s?. a. Compute the time and the distance does Clarissa have to run before she can overtake the bus. b. At the instant she reaches the bus, how fast is the bus moving?arrow_forward
 Principles of Physics: A Calculus-Based TextPhysicsISBN:9781133104261Author:Raymond A. Serway, John W. JewettPublisher:Cengage Learning