
Concept explainers
Videos
The Air Travel Consumer Report, a monthly product of the Department of Transportation’s Office of Aviation Enforcement and Proceedings (OAEP), is designed to assist consumer with information on the quality of service provided by airlines. The report includes a summary of consumer complaints by industry group and by complaint category. A breakdown of 1,303 September 2016 consumer complaints based on industry group is given in the following table:
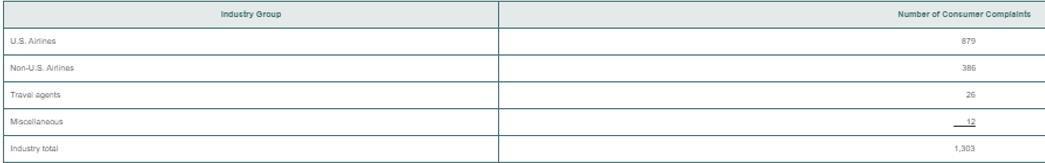
a. Construct a Pareto chart for the number of complaints by industry group. What industry group accounts for mast of the complaints?
The 1,303 consumer complaints against airlines are summarized by type in the following table:
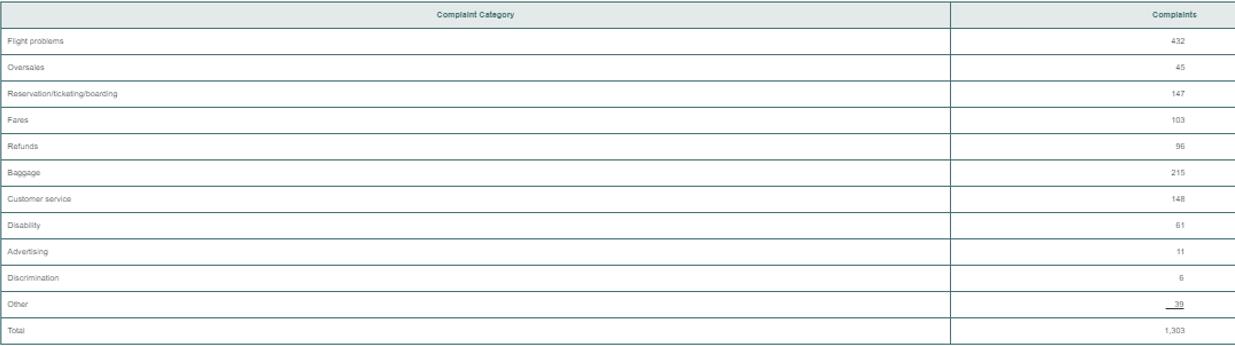
b. Construct pie and doughnut charts to display the percentage of complaints by type. What complaint category accounts for most of the complaints?
Want to see the full answer?
Check out a sample textbook solution
Chapter 2 Solutions
BASIC BUSINESS STAT LL W/MYLAB


- What is a sample space?arrow_forwardA local West Lafayette commercial bank issues Mastercard credit cards. As a part of its annual review of the profitability of each type of credit card, the bank randomly samples 36 customers to measure the average annual charges per card. A random sample of 36 Mastercard accounts shows the following annual spending per account (in USD): 2869 3770 2854 2750 2574 2972 2549 3267 3013 2707 2794 1189 2230 2178 3032 3485 2679 2010 1994 2768 3853 2064 3244 2738 2807 2395 3405 3006 3368 2691 1996 3008 2518 2674 2730 3719 1. Based on these randomly sampled accounts, what is the best point estimate of the true mean annual spending for Mastercard account holders? 2. Develop a 95% confidence interval estimate of the mean annual spending. Interpret this range. 3. To encourage more use of the card, the company offers a promotion that costs the bank $5 for each card that carries a balance of $3,000 or more. If the bank has 50,000 total customers, what can be stated about the cost of this…arrow_forwardThe Canmark Research Center Airport Customer Satisfaction Survey uses an online questionnaire to provide airlines and airports with customer satisfaction ratings for all aspects of the customers’ flight experience (airportsurvey website, July 2012). After completing a flight, customers receive an e-mail asking them to go to the website and rate a variety of factors, including the reservation process, the check-in process, luggage policy, cleanliness of gate area, service by flight attendants, food/beverage selection, ontime arrival, and so on. A five-point scale, with Excellent (E), Very Good (V), Good (G), Fair (F), and Poor (P), is used to record customer ratings. Assume that passengers on a delta Airlines flight from Myrtle beach, South Carolina, to Atlanta, Georgia, provided the following ratings for the question, “Please rate the airline based on your overall experience with this flight.” The sample ratings are shown below. E E G V V E V V V E E G V E E V E E E V V V V F V…arrow_forward
- The Canmark Research Center Airport Customer Satisfaction Surveyuses an online questionnaire to provide airlines and airports withcustomer satisfaction ratings for all aspects of the customers' flightexperience (airportsurvey website, July 2012). After completing a flight,customers receive an e-mail asking them to go to the website and rate a variety of factors, including the reservation process, the check-inprocess, luggage policy, cleanliness of gate area, service by flightattendants, food/beverage selection, on-time arrival, and so on. A five-point scale, with Excellent (E), Very Good (V), Good (G), Fair (F), and PoorP), is used to record customer ratings. Assume that passengers on a delta Airlines flight from Myrtle beach, South Carolina, to Atlanta, Georgia, provided the following ratings for the question, "Please rate theairline based on your overall experience with this flight." The sampleratings are shown attached. a. Use a percent frequency distribution and a bar chart…arrow_forwardThe National Assessment for Educational Progress (NAEP) is a U.S. government organization that assesses the performance of students and schools at all levels across the United States. The following table presents the percentage of eighth-grade students who were found to be proficient in mathematics and the percentage who were found to be proficient in reading in each of the ten most populous states. Use excels to find: State Percentage Proficient in Reading Percentage Proficient in Mathematics California 60 59 Texas 73 78 New York 75 70 Florida 66 68 Illinois 75 70 Pennsylvania 79 77 Ohio 79 76 Michigan 73 66 Georgia 67 64 North Carolina 71 73 Activities: Construct a scatterplot with reading proficiency on the horizontal axis and math proficiency on the vertical axis. Is there a linear relationship? Compute the correlation between reading proficiency and math proficiency. Is the linear…arrow_forwardA corporation administers an aptitude test to all new sales representatives. Management is interested in the extent to which this test is able to predict their eventual success. The accompanying table records average weekly sales (in thousands of pesos) and aptitude test scores for a random sample of eight representatives.arrow_forward
- According to the IRS, individuals filing federal income tax returns prior to March 31 received an average refund of $1056 in 2018. Consider the population of “last-minute” filers who mail their tax return during the last five days of the income tax period (typically April 10 to April 15). A researcher suggests that a reason individuals wait until the last five days is that on average these individuals receive lower refunds than do early filers. For a sample of 400 individuals who filed a tax return between April 10 and 15, the sample mean refund was $910. Based on prior experience, a population standard deviation of σ = $1,600 may be assumed. Test the researcher's assertion using the critical value approach. Use α = 0.05 (Please include all the 7 steps in hypothesis testing) Steps in hypothesis testing p-value Approach Develop the null and alternative hypothesis Specify the level of significance, α Choose the test statistic (z or t) Calculate the test statistic Use the value of the…arrow_forwardA Pew Research study conducted in 2017 found that approximately 75% of Americans believe that robots and computers might one day do many of the jobs currently done by people.† Suppose we have the following data collected from nurses, tax auditors, and fast-food workers in which a higher score means the person feels his or her job is more likely to be automated. Nurse TaxAuditor Fast-FoodWorker 3 4 5 4 5 8 6 4 6 2 4 8 3 6 5 3 3 6 4 5 6 5 3 4 (a) Use ? = 0.05 to test for differences in the belief that a person's job is likely to be automated for the three professions. State the null and alternative hypotheses. H0: μNurse = μTax auditor = μFast-food worker Ha: μNurse ≠ μTax auditor ≠ μFast-food worker H0: At least two of the population means are equal. Ha: At least two of the population means are different. H0: Not all the population means are equal. Ha: μNurse = μTax auditor = μFast-food worker H0: μNurse = μTax auditor = μFast-food worker Ha:…arrow_forwardA Pew Research study conducted in 2017 found that approximately 75% of Americans believe that robots and computers might one day do many of the jobs currently done by people.† Suppose we have the following data collected from nurses, tax auditors, and fast-food workers in which a higher score means the person feels his or her job is more likely to be automated. Nurse TaxAuditor Fast-FoodWorker 4 4 5 4 5 8 5 6 6 2 3 8 2 6 5 3 3 6 4 5 5 6 2 5 (a)Use ? = 0.05 to test for differences in the belief that a person's job is likely to be automated for the three professions. State the null and alternative hypotheses. 1. H0: μNurse = μTax auditor = μFast-food worker Ha: Not all the population means are equal. 2. H0: Not all the population means are equal. Ha: μNurse = μTax auditor = μFast-food worker 3. H0: At least two of the population means are equal. Ha: At least two of the population means are different. 4. H0: μNurse ≠ μTax auditor ≠ μFast-food worker…arrow_forward
- The table cross-classifies 68,694 passengers in cars and light trucks involved in accidents in the state of Maine by whether or not they were wearing a seat belt and by whether or not they were injured or killed. The study is using seatbelt wearing to predict injury/death. Injured or Killed? Wore Seatbelt? Yes No Total No 3,865 27,037 30,902 Yes 2,409 35,383 37,792 Total 6,274 62,420 68,694 What are the odds that a passenger was injured or killed if he/she did not wear a seatbelt (Row 1 odds)? What are the odds that a passenger was injured or killed if he/she wore a seatbelt (Row 2 odds)? Interpret both results. Describe the strength of the association between seatbelt use and injury/death using the odds ratio. Calculate the odds ratio and interpret the result?arrow_forwardBased on a survey of 12,344 U.S. college students and 6,729 Canadian college students, Kuo, Adlaf, Lee, Gliksman, Demers, and Wechsler (2002) report that alcohol use is more common among Canadian than U.S. students, but heavy drinking (five or more drinks in a row for males, four or more for females) is significantly higher among U.S. students than Canadian students. Is this an example of a survey research design?arrow_forwardRecently airlines have cut services, such as meals and snacks during flights, and started charging extra for some services, such as accommodating overweight luggage, last-minute flight changes, and pets traveling in the cabin. However, they are still concerned about service. Recently, a group of four carriers hired Brunner Marketing Research Inc. to survey passengers regarding their level of satisfaction with a recent flight. The survey included questions on ticketing, boarding, in-flight service, baggage handling, pilot communication, and so forth. Twenty-five questions offered a range of possible answers: excellent, good, fair, or poor. A response of excellent was given a score of 4, good a 3, fair a 2, and poor a 1. These responses were then totaled, so the total score was an indication of the satisfaction with the flight. The greater the score, the higher the level of satisfaction with the service. The highest possible score was 100. Brunner randomly selected and surveyed…arrow_forward
 Holt Mcdougal Larson Pre-algebra: Student Edition...AlgebraISBN:9780547587776Author:HOLT MCDOUGALPublisher:HOLT MCDOUGAL