
BASIC BUSINESS STAT LL W/MYLAB
14th Edition
ISBN: 9780135991459
Author: BERENSON
Publisher: PEARSON
expand_more
expand_more
format_list_bulleted
Concept explainers
Videos
Textbook Question
Chapter 2, Problem 9PS
A study of selected Kickstarter projects showed that overall a majority were successful, achieving their goal and raising, at a minimum, the targeted amounts. In an effort to identify project types that influence success, selected projects were subdivided into project categories (Film & video, Games, music, and Technology). The results are as follows:
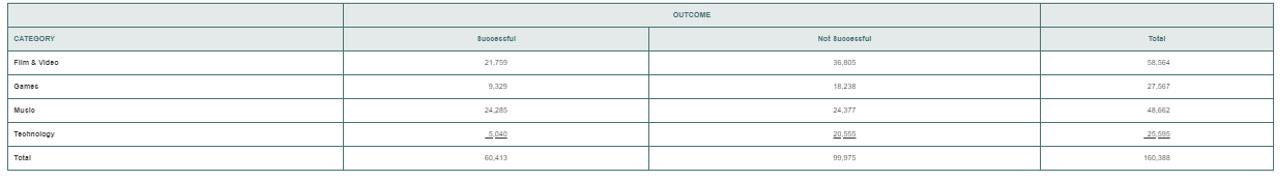
a. Construct
b. Which type of percentage– row, column, or total–do you think is most information for these data? Explain.
c. What conclusions concerning the pattern of successful Kickstarter projects can you reach?
Expert Solution & Answer
Want to see the full answer?
Check out a sample textbook solution
Students have asked these similar questions
The following data represent the responses to two questions asked in a survey of 40 college students majoring in business: What is your gender? 1M = male; F = female2 and What is your major? (A = Accounting; S = Statistics; M = Marketing):
Q1. Tally the data into a contingency table where the two rows represent the gender categories and the three columns represent the academic major categories.
Q2. Construct contingency tables based on percentages of all 40 student responses, based on row percentages and based on column percentages.
City
Hotel Room Rate ($)
Entertainment ($)
Boston
144
161
Denver
96
103
Nashville
88
103
New Orleans
112
143
Phoenix
89
100
San Diego
100
119
San Francisco
137
166
San Jose
93
138
Tampa
86
99
Concur Technologies, Inc., is a large expense-management company located in Redmond, Washington. The Wall Street Journal asked Concur to examine the data from 8.3 million expense reports to provide insights regarding business travel expenses. Their analysis of the data showed that New York was the most expensive city, with an average daily hotel room rate of $198 and an average amount spent on entertainment, including group meals and tickets for shows, sports, and other events, of $172. In comparison, the U.S. averages for these two categories were $89 for the room rate and $99 for entertainment. The table in the Excel Online file below shows the average daily hotel room rate and the amount spent on entertainment for a random sample of 9 of the 25 most visited U.S. cities (The…
The table below contains the total cost ($) for four tickets to a basketball game purchased on the secondary market, two beers, two soft drinks, two hot dogs, and one parking space at each arena during a recent season.
215.02
224.58
224.43
215.97
203.04
287.43
261.25
214.76
395.96
317.13
301.05
370.49
310.61
319.41
319.33
420.73
420.32
481.66
484.87
430.76
411.28
543.08
566.08
535.56
532.38
619.08
727.78
766.28
791.92
897.06
a. Organize these costs as an ordered array.
b. Construct a frequency distribution and a percentage distribution for these costs.
c. Around what values, if any, are at least 75% of the costs of attending the game concentrated? Explain.
At least 75% of the costs of attending a game are concentrated around the class groupings
"$200
but less than
$400"
and
"$500
but less than
$700."
B.
At least 75% of…
Chapter 2 Solutions
BASIC BUSINESS STAT LL W/MYLAB
Ch. 2 - A categorical variable has three categories, with...Ch. 2 - The following data represent the responses to two...Ch. 2 - The following table, stored in Smartphones Sales,...Ch. 2 - The Consumer Financial Protection Bureau reports...Ch. 2 - In addition to the impact of Big Data, what...Ch. 2 - This table represents the summer power-generating...Ch. 2 - Timetric’s 2016 survey of insurance...Ch. 2 - A survey of 1,520 Americans adults asked “Do you...Ch. 2 - A study of selected Kickstarter projects showed...Ch. 2 - Do special recommendations increase ad...
Ch. 2 - Construct an ordered array, given the following...Ch. 2 - Construct an ordered array, given the following...Ch. 2 - Planning and preparing for the unexpected,...Ch. 2 - Data was collected on salaries of compliance...Ch. 2 - The file NBACost contains the total cost ($ ) for...Ch. 2 - The file Utility contains the following data about...Ch. 2 - How much time do commuters living in or near...Ch. 2 - How do the average credit scores of people living...Ch. 2 - One operation of a mill is to cut pieces of steel...Ch. 2 - Call centers today play an important role in...Ch. 2 - The financial service call centre in problem 2.20...Ch. 2 - The file Bulbs contains the life (in hours) of a...Ch. 2 - The file Drink Contains the following data for the...Ch. 2 - A survey of online shoppers revealed that in 2015...Ch. 2 - How do college students spend their day? The 2016...Ch. 2 - The Energy Information Administration reported the...Ch. 2 - The Consumer Financial Protection Bureau reports...Ch. 2 - The following table indicates the percentage of...Ch. 2 - Timetric’s 2016 survey of insurance...Ch. 2 - A survey of 1,520 American adults asked “Do you...Ch. 2 - A study of selected Kickstarter projects showed...Ch. 2 - Do special recommendations increase ad...Ch. 2 - Construct a stern-and-leaf display, given the...Ch. 2 - Construct an ordered array, given the following...Ch. 2 - The following is a stern-and0-leaf display...Ch. 2 - The file NBACost contains the total cost in$ for...Ch. 2 - The file MobileSpeed contains the overall download...Ch. 2 - The file Utility contains the following data about...Ch. 2 - As player salaries have increases, the cost of...Ch. 2 - The following histogram and cumulative percentage...Ch. 2 - How much time do Americans living in cities spend...Ch. 2 - How do the average credit scores of people living...Ch. 2 - One operation of a mill is to cut pieces of steel...Ch. 2 - Call centers today play an important role in...Ch. 2 - The financial service call center in problem 2.44...Ch. 2 - The file Bulbs contains the life (in hours) of a...Ch. 2 - The data stored in Drink represents the amount of...Ch. 2 - The following is a set of data from a sample of...Ch. 2 - The following is a series of annual sales...Ch. 2 - Movie companies need to predict the gross receipts...Ch. 2 - Data were collected on the typical cost of dining...Ch. 2 - The file Mobile contains the overall download and...Ch. 2 - A Pew Research Center survey found a noticeable...Ch. 2 - How have stocks performed in the past? The...Ch. 2 - The file NewHomeSales contains the number of new...Ch. 2 - The file Movie Attendance 16 contains the yearly...Ch. 2 - The Super Bowl is a big viewing event watched by...Ch. 2 - Using the sample of retirement funds stored in...Ch. 2 - Using the sample of retirement funds stored in...Ch. 2 - Prob. 60PSCh. 2 - Using the sample of retirement funds stored in...Ch. 2 - Prob. 62PSCh. 2 - Using the sample of retirement funds stored in...Ch. 2 - Prob. 64PSCh. 2 - Using the sample of retirement funds stored in...Ch. 2 - Prob. 66PSCh. 2 - Prob. 67PSCh. 2 - Prob. 68PSCh. 2 - Prob. 71PSCh. 2 - Prob. 72PSCh. 2 - Examine the following visualization, adapted from...Ch. 2 - Prob. 75PSCh. 2 - Prob. 76PSCh. 2 - How do histograms and polygons differ in...Ch. 2 - Why would you construct a summary table?Ch. 2 - What are the advantages and disadvantage of using...Ch. 2 - Compare and contrast the bar chart for categorical...Ch. 2 - What is the difference between a time-series plot...Ch. 2 - Why is it said that the main feature of a Pareto...Ch. 2 - What are the three different ways to break down...Ch. 2 - How can a multidimensional table differ from a...Ch. 2 - What type of insights can you gain from a...Ch. 2 - Prob. 86PSCh. 2 - What is the difference between a time-series plot...Ch. 2 - The following table shown in the TextbookCosts...Ch. 2 - The following table represents the market share...Ch. 2 - B2B marketers in North America were surveyed about...Ch. 2 - The owner of a restaurant that services...Ch. 2 - Suppose that the owner of the restaurant in...Ch. 2 - The following data represents the pounds per...Ch. 2 - The Air Travel Consumer Report, a monthly product...Ch. 2 - One of the major measures of the quality of...Ch. 2 - The file DomesticBeer Contains the percentage...Ch. 2 - Prob. 97PSCh. 2 - The file CDRate contains the yields for one-year...Ch. 2 - The file CEO 2016 includes the total compensation...Ch. 2 - Prob. 100PSCh. 2 - What was the average price of a room at two-star,...Ch. 2 - The file Protein contains calorie and cholesterol...Ch. 2 - The file Natural Gas contains the U.S. monthly...Ch. 2 - The data stored in Drink represent the amount of...Ch. 2 - Prob. 105PSCh. 2 - A/B testing allows business to test a new design...Ch. 2 - Referring to the results from Problem 2.100 on...
Knowledge Booster


Learn more about
Need a deep-dive on the concept behind this application? Look no further. Learn more about this topic, statistics and related others by exploring similar questions and additional content below.Similar questions
- What percentage of customers in the sample prefer Action movies ? Complete the frequency table based on the Pivot table information MovieGenre Female Male Total Action Comedy Drama SciFi Total INSERT PIVOT TABLE HERE Sum of DollarAmt ($) Column Labels Row Labels Female Male Grand Total Action 2361 1715 4076 Comedy 1614 95 1709 Drama 4399 6403 10802 SciFi 5133 2636 7769 Grand Total 13507 10849 24356arrow_forwardA college president has received budgets from the athletic director (AD), dean of students (DS), and student senate president (SP), in which they propose to allocate department funds to the three basic areas of student scholarships, activities, and services, as shown in the table.The Board of Regents has requested that the overall distribution of funding to these three areas be in the following proportions: scholarships, 34%; activities, 33%; and services, 33%. Determine what percentage of the total funds the president should allocate to each department so that the percentages spent in these three areas conform to the Board of Regents’ requirements.arrow_forwardAshton surveyed the students in his neighborhood and obtained the following contingency table that summarizes the school enrollment by level and type:arrow_forward
- The data contained in the file FoodIndustry show the company/chain name, the average sales per store ($1,000s), and the food segment industry for 47 restaurant chains.† Company Segment 2012 U.S.AverageSales perStore($1,000s) Arby's Sandwich 993 Baskin-Robbins Snacks 207 Bojangles' Chicken 1,718 Boston Market Chicken 1,184 Burger King Burger 1,195 Carl's Jr. Burger 1,470 Checkers/Rally's Burger 903 Chick-fil-A Chicken 3,158 Chipotle MexicanGrill Mexican 2,113 Church's Chicken Chicken 707 CiCi's Pizza Pizza/Pasta 915 Culver's Burger 1,838 Dairy Queen Burger 545 Del Taco Mexican 1,100 Domino's Pizza Pizza/Pasta 710 Dunkin' Donuts Snacks 857 El Pollo Loco Chicken 1,475 Five GuysBurgers & Fries Burger 1,049 Hardee's Burger 1,145 In-N-Out Burger Burger 1,935 Jack in the Box Burger 1,379 Jamba Juice Snacks 715 Jason's Deli Sandwich 2,556 Jimmy John's Sandwich 879 Company Segment 2012 U.S.AverageSales perStore($1,000s) KFC…arrow_forwardThe data contained in the file FoodIndustry show the company/chain name, the average sales per store ($1,000s), and the food segment industry for 47 restaurant chains.† Company Segment 2012 U.S.AverageSales perStore($1,000s) Arby's Sandwich 993 Baskin-Robbins Snacks 207 Bojangles' Chicken 1,718 Boston Market Chicken 1,184 Burger King Burger 1,195 Carl's Jr. Burger 1,470 Checkers/Rally's Burger 903 Chick-fil-A Chicken 3,158 Chipotle MexicanGrill Mexican 2,113 Church's Chicken Chicken 707 CiCi's Pizza Pizza/Pasta 915 Culver's Burger 1,838 Dairy Queen Burger 545 Del Taco Mexican 1,100 Domino's Pizza Pizza/Pasta 710 Dunkin' Donuts Snacks 857 El Pollo Loco Chicken 1,475 Five GuysBurgers & Fries Burger 1,049 Hardee's Burger 1,145 In-N-Out Burger Burger 1,935 Jack in the Box Burger 1,379 Jamba Juice Snacks 715 Jason's Deli Sandwich 2,556 Jimmy John's Sandwich 879 Company Segment 2012 U.S.AverageSales perStore($1,000s) KFC…arrow_forwardThe table below contains the total cost ($) for four tickets to a basketball game purchased on the secondary market, two beers, two soft drinks, two hot dogs, and one parking space at each arena during a recent season. 290.24 201.69 234.33 282.03 263.89 273.47 264.47 240.17 369.58 308.31 382.64 350.91 330.95 336.79 380.73 448.45 408.98 420.79 417.76 443.36 487.68 508.87 569.96 539.05 544.23 676.06 727.83 768.33 709.92 882.69 a. Organize these costs as an ordered array. b. Construct a frequency distribution and a percentage distribution for these costs. c. Around what values, if any, are at least 75% of the costs of attending the game concentrated? Explain.arrow_forward
- The contingency table below shows the results of a survey of video viewing habits by age. Viewer age Mobile/Laptop Device / TV screen / Row Total 18-34 34 39 73 35-54 10 10 20 55+ 2 5 7 Column Total 46 54 100 (A)Calculate the percentage of viewers GIVEN they are 18-34 who prefer videos on a mobile or laptop device (round answers to two places). ______% of viewers (B) Calculate percentage of viewers who are 35-54 OR prefer videos on a mobile or laptop device. _____% of viewersarrow_forwardStudies show that about 18 percent of all businesses in the United States are minority-owned.Brian lives in Centerville, a town with a population of 25,000 and 200 businesses. Assuming that the national percentage holds true for the businesses in Centerville, how many of these are minority-owned?arrow_forwardSales, Production, Direct Materials Purchases, and Direct Labor Cost Budgets The budget director of Gourmet Grill Company requests estimates of sales, production, and other operating data from the various administrative units every month. Selected information concerning sales and production for July is summarized as follows: a. Estimated sales for July by sales territory: Maine: Backyard Chef 310 units at $700 per unit Master Chef 150 units at $1,200 per unit Vermont: Backyard Chef 240 units at $750 per unit Master Chef 110 units at $1,300 per unit New Hampshire: Backyard Chef 360 units at $750 per unit Master Chef 180 units at $1,400 per unit b. Estimated inventories at July 1: Direct materials: Grates 290 units Stainless steel 1,500 lbs. Burner subassemblies 170 units Shelves 340 units Finished products: Backyard Chef 30 units Master Chef 32 units c. Desired inventories at July 31: Direct materials: Grates 340 units Stainless steel…arrow_forward
- An auto supplies company has retail stores located in eight cities in California. The price they charge for a particular product in each city varies because of differing competitive conditions. For instance, the price they charge for a case of a popular brand of motor oil in each city follows. Also shown are the number of cases that the company sold last quarter in each city. City Price ($) Sales (cases) Bakersfield 34.99 581 Los Angeles 38.99 1,475 Modesto 36.00 324 Oakland 33.59 902 Sacramento 40.99 745 San Diego 38.59 1,188 San Francisco 39.59 1,614 San Jose 37.99 859 Compute the average sales price per case for this product during the last quarter. (Round your answer to two decimal places.) $arrow_forwardUse the data from Fuentes’ study to test the hypothesis that the proportion of grocery stores that currently carries Fuentes’ Candied Bacon Potato Chips is equal across its eight U.S. sales regions. Use a 5 .05. New England Mid-Atlantic Midwest Great Plains South Atlantic Deep South Mountain Pacific Yes Yes No No Yes Yes Yes No No Yes Yes Yes Yes Yes Yes No Yes Yes No Yes No Yes No No Yes No Yes Yes Yes Yes Yes No Yes Yes No Yes Yes Yes No Yes No No No Yes No Yes No No Yes Yes Yes Yes Yes Yes Yes No No Yes Yes No Yes No Yes Yes Yes No No No Yes Yes Yes Yes Yes No No Yes Yes Yes No No Yes Yes Yes Yes Yes Yes No Yes Yes No No Yes Yes No Yes No No Yes Yes Yes Yes Yes No No No Yes Yes Yes Yes Yes Yes Yes Yes Yes Yes Yes Yes Yes No Yes No Yes No No Yes Yes No No No Yes No Yes Yes Yes Yes Yes No No Yes Yes Yes Yes No Yes No Yes No Yes Yes Yes Yes No Yes No Yes Yes Yes Yes No Yes Yes Yes Yes Yes Yes No Yes Yes Yes Yes Yes Yes Yes Yes Yes No…arrow_forwardAn advertising company is comparing published listening figures for differentradio stations and podcasts in order to decide where is the best place to puttheir adverts. The audience figures for the last 20 quarters of radio stationsA and B are in Table 1.Table 1 Audience figures in 100 000’s of radio stations A and B for the last20 quartersRadio Station A Radio Station B109 95103 98105 97110 96108 97106 96105 97109 95112 93112 94115 95111 91113 92112 96115 102105 103109 100107 106105 108108 104page 3 of 9(a) (i) Find the summary values for radio stations A and B, usingDataplotter or otherwise. Copy and complete the table below.Round values, where necessary, to one decimal place. The mean,rounded to one decimal place, is given for you as a check that youhave entered the data correctly. [1]Table 2 Summary values of audience figures in 100 000’s for radiostations A and B.Radio Station A Radio Station BMinMedianMaxMean 109.0 97.8SDIQRRange(ii) Use the two measures of location to say which…arrow_forward
arrow_back_ios
SEE MORE QUESTIONS
arrow_forward_ios
Recommended textbooks for you
 MATLAB: An Introduction with ApplicationsStatisticsISBN:9781119256830Author:Amos GilatPublisher:John Wiley & Sons Inc
 Probability and Statistics for Engineering and th...StatisticsISBN:9781305251809Author:Jay L. DevorePublisher:Cengage Learning
 Statistics for The Behavioral Sciences (MindTap C...StatisticsISBN:9781305504912Author:Frederick J Gravetter, Larry B. WallnauPublisher:Cengage Learning
 Elementary Statistics: Picturing the World (7th E...StatisticsISBN:9780134683416Author:Ron Larson, Betsy FarberPublisher:PEARSON
 The Basic Practice of StatisticsStatisticsISBN:9781319042578Author:David S. Moore, William I. Notz, Michael A. FlignerPublisher:W. H. Freeman
 Introduction to the Practice of StatisticsStatisticsISBN:9781319013387Author:David S. Moore, George P. McCabe, Bruce A. CraigPublisher:W. H. Freeman
MATLAB: An Introduction with Applications
Statistics
ISBN:9781119256830
Author:Amos Gilat
Publisher:John Wiley & Sons Inc
Probability and Statistics for Engineering and th...
Statistics
ISBN:9781305251809
Author:Jay L. Devore
Publisher:Cengage Learning
Statistics for The Behavioral Sciences (MindTap C...
Statistics
ISBN:9781305504912
Author:Frederick J Gravetter, Larry B. Wallnau
Publisher:Cengage Learning
Elementary Statistics: Picturing the World (7th E...
Statistics
ISBN:9780134683416
Author:Ron Larson, Betsy Farber
Publisher:PEARSON
The Basic Practice of Statistics
Statistics
ISBN:9781319042578
Author:David S. Moore, William I. Notz, Michael A. Fligner
Publisher:W. H. Freeman
Introduction to the Practice of Statistics
Statistics
ISBN:9781319013387
Author:David S. Moore, George P. McCabe, Bruce A. Craig
Publisher:W. H. Freeman
Statistics 4.1 Point Estimators; Author: Dr. Jack L. Jackson II;https://www.youtube.com/watch?v=2MrI0J8XCEE;License: Standard YouTube License, CC-BY
Statistics 101: Point Estimators; Author: Brandon Foltz;https://www.youtube.com/watch?v=4v41z3HwLaM;License: Standard YouTube License, CC-BY
Central limit theorem; Author: 365 Data Science;https://www.youtube.com/watch?v=b5xQmk9veZ4;License: Standard YouTube License, CC-BY
Point Estimate Definition & Example; Author: Prof. Essa;https://www.youtube.com/watch?v=OTVwtvQmSn0;License: Standard Youtube License
Point Estimation; Author: Vamsidhar Ambatipudi;https://www.youtube.com/watch?v=flqhlM2bZWc;License: Standard Youtube License