
BASIC BUSINESS STAT LL W/MYLAB
14th Edition
ISBN: 9780135991459
Author: BERENSON
Publisher: PEARSON
expand_more
expand_more
format_list_bulleted
Videos
Textbook Question
Chapter 2, Problem 56PS
The file Movie Attendance 16 contains the yearly movie attendance (in billions) from 2001
through 2016.
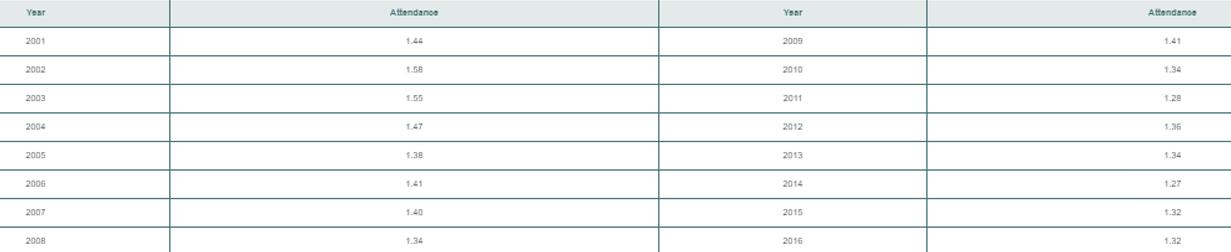
a. Construct a time-series plot for the movie attendance (in billions).
b. What pattern, if any, is present in the data?
Expert Solution & Answer
Want to see the full answer?
Check out a sample textbook solution
Students have asked these similar questions
the values of alabama building contracts (in $ millions) for a 12-month period follow.240 350 230 260 280 320 220 310 240 310 240 230a. construct a time series plot. What type of pattern exists in the data?
Which of the following time series forecasting methods would not be used to forecast seasonal data?
For the hawkins company, the monthly percentages of all shipments received on timeover the past 12 months are 80, 82, 84, 83, 83, 84, 85, 84, 82, 83, 84, and 83.a. construct a time series plot. What type of pattern exists in the data?
Chapter 2 Solutions
BASIC BUSINESS STAT LL W/MYLAB
Ch. 2 - A categorical variable has three categories, with...Ch. 2 - The following data represent the responses to two...Ch. 2 - The following table, stored in Smartphones Sales,...Ch. 2 - The Consumer Financial Protection Bureau reports...Ch. 2 - In addition to the impact of Big Data, what...Ch. 2 - This table represents the summer power-generating...Ch. 2 - Timetric’s 2016 survey of insurance...Ch. 2 - A survey of 1,520 Americans adults asked “Do you...Ch. 2 - A study of selected Kickstarter projects showed...Ch. 2 - Do special recommendations increase ad...
Ch. 2 - Construct an ordered array, given the following...Ch. 2 - Construct an ordered array, given the following...Ch. 2 - Planning and preparing for the unexpected,...Ch. 2 - Data was collected on salaries of compliance...Ch. 2 - The file NBACost contains the total cost ($ ) for...Ch. 2 - The file Utility contains the following data about...Ch. 2 - How much time do commuters living in or near...Ch. 2 - How do the average credit scores of people living...Ch. 2 - One operation of a mill is to cut pieces of steel...Ch. 2 - Call centers today play an important role in...Ch. 2 - The financial service call centre in problem 2.20...Ch. 2 - The file Bulbs contains the life (in hours) of a...Ch. 2 - The file Drink Contains the following data for the...Ch. 2 - A survey of online shoppers revealed that in 2015...Ch. 2 - How do college students spend their day? The 2016...Ch. 2 - The Energy Information Administration reported the...Ch. 2 - The Consumer Financial Protection Bureau reports...Ch. 2 - The following table indicates the percentage of...Ch. 2 - Timetric’s 2016 survey of insurance...Ch. 2 - A survey of 1,520 American adults asked “Do you...Ch. 2 - A study of selected Kickstarter projects showed...Ch. 2 - Do special recommendations increase ad...Ch. 2 - Construct a stern-and-leaf display, given the...Ch. 2 - Construct an ordered array, given the following...Ch. 2 - The following is a stern-and0-leaf display...Ch. 2 - The file NBACost contains the total cost in$ for...Ch. 2 - The file MobileSpeed contains the overall download...Ch. 2 - The file Utility contains the following data about...Ch. 2 - As player salaries have increases, the cost of...Ch. 2 - The following histogram and cumulative percentage...Ch. 2 - How much time do Americans living in cities spend...Ch. 2 - How do the average credit scores of people living...Ch. 2 - One operation of a mill is to cut pieces of steel...Ch. 2 - Call centers today play an important role in...Ch. 2 - The financial service call center in problem 2.44...Ch. 2 - The file Bulbs contains the life (in hours) of a...Ch. 2 - The data stored in Drink represents the amount of...Ch. 2 - The following is a set of data from a sample of...Ch. 2 - The following is a series of annual sales...Ch. 2 - Movie companies need to predict the gross receipts...Ch. 2 - Data were collected on the typical cost of dining...Ch. 2 - The file Mobile contains the overall download and...Ch. 2 - A Pew Research Center survey found a noticeable...Ch. 2 - How have stocks performed in the past? The...Ch. 2 - The file NewHomeSales contains the number of new...Ch. 2 - The file Movie Attendance 16 contains the yearly...Ch. 2 - The Super Bowl is a big viewing event watched by...Ch. 2 - Using the sample of retirement funds stored in...Ch. 2 - Using the sample of retirement funds stored in...Ch. 2 - Prob. 60PSCh. 2 - Using the sample of retirement funds stored in...Ch. 2 - Prob. 62PSCh. 2 - Using the sample of retirement funds stored in...Ch. 2 - Prob. 64PSCh. 2 - Using the sample of retirement funds stored in...Ch. 2 - Prob. 66PSCh. 2 - Prob. 67PSCh. 2 - Prob. 68PSCh. 2 - Prob. 71PSCh. 2 - Prob. 72PSCh. 2 - Examine the following visualization, adapted from...Ch. 2 - Prob. 75PSCh. 2 - Prob. 76PSCh. 2 - How do histograms and polygons differ in...Ch. 2 - Why would you construct a summary table?Ch. 2 - What are the advantages and disadvantage of using...Ch. 2 - Compare and contrast the bar chart for categorical...Ch. 2 - What is the difference between a time-series plot...Ch. 2 - Why is it said that the main feature of a Pareto...Ch. 2 - What are the three different ways to break down...Ch. 2 - How can a multidimensional table differ from a...Ch. 2 - What type of insights can you gain from a...Ch. 2 - Prob. 86PSCh. 2 - What is the difference between a time-series plot...Ch. 2 - The following table shown in the TextbookCosts...Ch. 2 - The following table represents the market share...Ch. 2 - B2B marketers in North America were surveyed about...Ch. 2 - The owner of a restaurant that services...Ch. 2 - Suppose that the owner of the restaurant in...Ch. 2 - The following data represents the pounds per...Ch. 2 - The Air Travel Consumer Report, a monthly product...Ch. 2 - One of the major measures of the quality of...Ch. 2 - The file DomesticBeer Contains the percentage...Ch. 2 - Prob. 97PSCh. 2 - The file CDRate contains the yields for one-year...Ch. 2 - The file CEO 2016 includes the total compensation...Ch. 2 - Prob. 100PSCh. 2 - What was the average price of a room at two-star,...Ch. 2 - The file Protein contains calorie and cholesterol...Ch. 2 - The file Natural Gas contains the U.S. monthly...Ch. 2 - The data stored in Drink represent the amount of...Ch. 2 - Prob. 105PSCh. 2 - A/B testing allows business to test a new design...Ch. 2 - Referring to the results from Problem 2.100 on...
Knowledge Booster


Learn more about
Need a deep-dive on the concept behind this application? Look no further. Learn more about this topic, statistics and related others by exploring similar questions and additional content below.Similar questions
- Table 6 shows the year and the number ofpeople unemployed in a particular city for several years. Determine whether the trend appears linear. If so, and assuming the trend continues, in what year will the number of unemployed reach 5 people?arrow_forwardten weeks of data on the commodity Futures index are 7.35, 7.40, 7.55, 7.56, 7.60, 7.52,7.52, 7.70, 7.62, and 7.55.a. construct a time series plot. What type of pattern exists in the data?arrow_forwardThe following data set provides the total number of shipments of core major household appliances in the U.S. from 2000 to 2016 (in millions): Year Shipments (millions) 2000 38.4 2001 38.2 2002 40.8 2003 42.5 2004 46.1 2005 47.0 2006 46.7 2007 44.1 2008 39.8 2009 36.5 2010 38.2 2011 36.0 2012 35.8 2013 39.2 2014 41.5 2015 42.9 2016 44.7 a. Plot the time series. b. Fit a three-year moving average to the data and plot the results. c. Fit a five-year moving average to the data and plot the results. d. Compute a linear trend forecasting equation and plot the trend line. e. Compute a quadratic trend forecasting equation and plot the results.arrow_forward
- The folloiwing table shows data for U.S. movie theater admissions (per week). Display the data as a time-series graph and write a short paragraph explaining any noticeable trends or patterns. Year Admissions Year Admissions 1945 79.0 1985 20.30 1955 39.9 1995 23.3 1965 19.8 2005 26.5 1975 19.9 2015 25.4arrow_forwardWhich of the time series forecasting methods would not be used to forecast seasonal data?arrow_forwardThe table below contains the average price paid for a new home in a certain area from 2000 to 2010. a. Construct a time-series plot of new home prices. b. What pattern, if any, is present in the data? Year Average_Price_($_thousands)2000 351.12001 330.52002 310.52003 296.72004 229.72005 182.32006 154.52007 156.32008 154.72009 154.52010 154.5arrow_forward
- #4) Commuter ridership in Athens, Greece, during the summer months is believed to be heavily tied to the number of tourists visiting the city. During the past 12 years, the data are given in the following table. Year Number of Tourists (millions) Ridership (hundreds of thousands) 1 6 11 2 11 16 3 8 16 4 10 14 5 19 28 6 18 26 7 16 21 8 20 25 9 24 45 10 18 28 11 11 18 12 19 35 a) Create a time series plot for the ridership. b) Using linear regression to see if using the year is a good predictor for the ridership. What is the regression equation? How accurate is the model? c) Using linear regression to see if using the number of tourists is a good predictor for the ridership. What is the regression equation? How accurate is the model? d) Which linear regression equation is better? What is the expected ridership if 10 million tourists visit the city next year? e) Excel Filearrow_forwardWhich of the following is the most appropriate type of chart for determining the number of observations at or below a specific value? Select one: a. A histogram. b. A pie chart. c. A time-series chart. d. A cumulative frequency ogive.arrow_forwardFind out the next month after april income by using the forecasting method of the moving average methodarrow_forward
arrow_back_ios
arrow_forward_ios
Recommended textbooks for you

Time Series Analysis Theory & Uni-variate Forecasting Techniques; Author: Analytics University;https://www.youtube.com/watch?v=_X5q9FYLGxM;License: Standard YouTube License, CC-BY
Operations management 101: Time-series, forecasting introduction; Author: Brandoz Foltz;https://www.youtube.com/watch?v=EaqZP36ool8;License: Standard YouTube License, CC-BY