
a.
To draw: A payoff and profit diagram to depict a straddle position when the exercise price is $130.
Introduction:
Straddle Strategy: It is one of the strategies used in manipulating the call and put options. In this strategy, the investor faces a position where the call option and the put option are placed in the same position with the same strike price (X) and time (t). In other words, a straddle is supposed to be the combined value of both the call option and the put option.
a.
Answer to Problem 16PS
We can conclude that an increase in price increased profit also.
Explanation of Solution
The information given to us is as follows:
| Statement showing the prices of the options in straddles and spreads | ||||||||
| Straddles and Spreads | ||||||||
| Stock prices | ||||||||
| Market Price | 116.5 | |||||||
| Market price | 130 | X110 Straddle | X120 Straddle | |||||
| Ending Stock price | Profit | Ending Stock price | Profit | |||||
| Buying options: | -15.4 | -24 | ||||||
| Strike | Price | Payoff | Profit | Return% | 50 | 24.6 | 50 | 36 |
| 110 | 22.8 | 20 | -2.8 | -12.28% | 60 | 14.6 | 60 | 26 |
| 120 | 16.8 | 10 | -6.8 | -40.48% | 70 | 4.6 | 70 | 16 |
| 130 | 13.6 | 0 | -13.6 | -100.00% | 80 | -5.4 | 80 | 6 |
| 140 | 10.3 | 0 | -10.3 | -100.00% | 90 | -15.4 | 90 | -4 |
| 100 | -25.4 | 100 | -14 | |||||
| Strike | Price | Payoff | Profit | Return% | 110 | -35.4 | 110 | -24 |
| 110 | 12.6 | 0 | -12.6 | -100% | 120 | -25.4 | 120 | -34 |
| 120 | 17.2 | 0 | -17.2 | -100% | 130 | -15.4 | 130 | -24 |
| 130 | 23.6 | 0 | -23.6 | -100% | 140 | -5.4 | 140 | -14 |
| 140 | 30.5 | 10 | -20.5 | -67.21% | 150 | 4.6 | 150 | -4 |
| 160 | 14.6 | 160 | 6 | |||||
| Straddle | Price | Payoff | Profit | Return% | 170 | 24.6 | 170 | 16 |
| 110 | 35.4 | 20 | -15.4 | -43.50% | 180 | 34.6 | 180 | 26 |
| 120 | 34 | 10 | -24 | -70.59% | 190 | 44.6 | 190 | 36 |
| 130 | 37.2 | 0 | -37.2 | -100% | 200 | 54.6 | 200 | 46 |
| 140 | 40.8 | 10 | -30.8 | -75.49% | 210 | 64.6 | 210 | 56 |
| Selling options: | ||||||||
| Call options | Price | Payoff | Profit | Return% | Ending | Bullish Spread | ||
| Stock price | 7.5 | |||||||
| 110 | 22.8 | -20 | 2.8 | 12.28% | 50 | -12.5 | ||
| 120 | 16.8 | -10 | 6.8 | 40.48% | 60 | -12.5 | ||
| 130 | 13.6 | 0 | 13.6 | 100.00% | 70 | -12.5 | ||
| 140 | 10.3 | 0 | 10.3 | 100.00% | 80 | -12.5 | ||
| 90 | -12.5 | |||||||
| Put options | Price | Payoff | Profit | Return% | 100 | -12.5 | ||
| 110 | 16.6 | 0 | 12.6 | 100.00% | 110 | -12.5 | ||
| 120 | 17.2 | 0 | 17.2 | 100.00% | 120 | -2.5 | ||
| 130 | 23.6 | 0 | 23.6 | 100.00% | 130 | 7.5 | ||
| 140 | 30.5 | 10 | 40.5 | 132.79% | 140 | 17.5 | ||
| 150 | 17.5 | |||||||
| Money spread | Price | Payoff | Profit | 160 | 17.5 | |||
| Bullish spread | 170 | 17.5 | ||||||
| Purchase of Call option at 110 | 22.8 | 20 | -2.8 | 180 | 17.5 | |||
| Selling of Call option at 140 | 10.3 | 0 | 10.3 | 190 | 17.5 | |||
| Combined profit | 20 | 7.5 | 200 | 17.5 | ||||
| 210 | 17.5 | |||||||
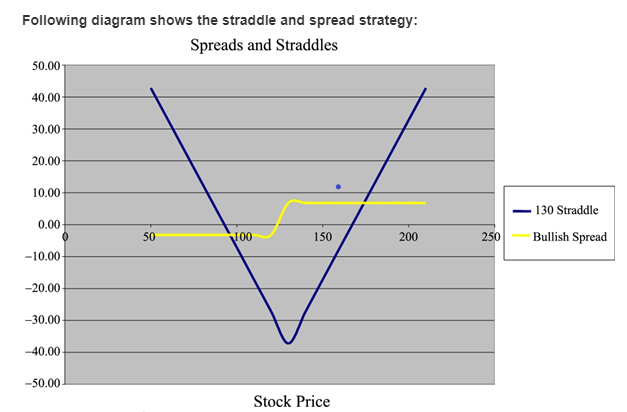
Let us use the same diagram for both the answers. Let us now understand the depiction of payoff and profit using a straddle strategy.
Like said before, in straddle strategy, both the call position and put position will be placed at the same place with the same strike price and expiration time. Let us observe the diagram. The blue shows the payoff and profit using a straddle strategy.
This diagram clears shows that when the price option of $110, the payoff is $20 and the net profit earned is $34.60. In a case where the price is $120, the profit earned is $44.60 and when the price rises to $130 the profit earned also rises to $54.60. Therefore, it means an increase in price increased profit also.
b.
To draw: A payoff and profit diagram to depict a bullish spread position when the exercise price is $120 and $130 assuming the excel position.
Introduction:
Bullish spread position: It is supposed to be a very optimistic option strategy. It is designed in such a way that profit can be earned even if there is a moderate increase in the price of the underlying asset.
b.
Answer to Problem 16PS
We can conclude that irrespective of a decline in market conditions, a net profit of $7.50 is earned.
Explanation of Solution
The information given to us is as follows:
| Statement showing the prices of the options in straddles and spreads | ||||||||
| Straddles and Spreads | ||||||||
| Stock prices | ||||||||
| Market Price | 116.5 | |||||||
| Market price | 130 | X110 Straddle | X120 Straddle | |||||
| Ending Stock price | Profit | Ending Stock price | Profit | |||||
| Buying options: | -15.4 | -24 | ||||||
| Strike | Price | Payoff | Profit | Return% | 50 | 24.6 | 50 | 36 |
| 110 | 22.8 | 20 | -2.8 | -12.28% | 60 | 14.6 | 60 | 26 |
| 120 | 16.8 | 10 | -6.8 | -40.48% | 70 | 4.6 | 70 | 16 |
| 130 | 13.6 | 0 | -13.6 | -100.00% | 80 | -5.4 | 80 | 6 |
| 140 | 10.3 | 0 | -10.3 | -100.00% | 90 | -15.4 | 90 | -4 |
| 100 | -25.4 | 100 | -14 | |||||
| Strike | Price | Payoff | Profit | Return% | 110 | -35.4 | 110 | -24 |
| 110 | 12.6 | 0 | -12.6 | -100% | 120 | -25.4 | 120 | -34 |
| 120 | 17.2 | 0 | -17.2 | -100% | 130 | -15.4 | 130 | -24 |
| 130 | 23.6 | 0 | -23.6 | -100% | 140 | -5.4 | 140 | -14 |
| 140 | 30.5 | 10 | -20.5 | -67.21% | 150 | 4.6 | 150 | -4 |
| 160 | 14.6 | 160 | 6 | |||||
| Straddle | Price | Payoff | Profit | Return% | 170 | 24.6 | 170 | 16 |
| 110 | 35.4 | 20 | -15.4 | -43.50% | 180 | 34.6 | 180 | 26 |
| 120 | 34 | 10 | -24 | -70.59% | 190 | 44.6 | 190 | 36 |
| 130 | 37.2 | 0 | -37.2 | -100% | 200 | 54.6 | 200 | 46 |
| 140 | 40.8 | 10 | -30.8 | -75.49% | 210 | 64.6 | 210 | 56 |
| Selling options: | ||||||||
| Call options | Price | Payoff | Profit | Return% | Ending | Bullish Spread | ||
| Stock price | 7.5 | |||||||
| 110 | 22.8 | -20 | 2.8 | 12.28% | 50 | -12.5 | ||
| 120 | 16.8 | -10 | 6.8 | 40.48% | 60 | -12.5 | ||
| 130 | 13.6 | 0 | 13.6 | 100.00% | 70 | -12.5 | ||
| 140 | 10.3 | 0 | 10.3 | 100.00% | 80 | -12.5 | ||
| 90 | -12.5 | |||||||
| Put options | Price | Payoff | Profit | Return% | 100 | -12.5 | ||
| 110 | 16.6 | 0 | 12.6 | 100.00% | 110 | -12.5 | ||
| 120 | 17.2 | 0 | 17.2 | 100.00% | 120 | -2.5 | ||
| 130 | 23.6 | 0 | 23.6 | 100.00% | 130 | 7.5 | ||
| 140 | 30.5 | 10 | 40.5 | 132.79% | 140 | 17.5 | ||
| 150 | 17.5 | |||||||
| Money spread | Price | Payoff | Profit | 160 | 17.5 | |||
| Bullish spread | 170 | 17.5 | ||||||
| Purchase of Call option at 110 | 22.8 | 20 | -2.8 | 180 | 17.5 | |||
| Selling of Call option at 140 | 10.3 | 0 | 10.3 | 190 | 17.5 | |||
| Combined profit | 20 | 7.5 | 200 | 17.5 | ||||
| 210 | 17.5 | |||||||

Let us use the same diagram for here also. Let us now understand the depiction of payoff and profit using a bullish spread strategy. The yellow line shown in the diagram depicts payoff and profit using a bullish spread strategy. When the diagram is observed, we find that when a call option is purchased at $110, the market is decreasing. When a call option is sold at $140, the net profit earned is $7.50. So, irrespective of a decline in market conditions, a net profit of $7.50 is earned.
Want to see more full solutions like this?
Chapter 20 Solutions
INVESTEMENTS (LL) W/CONNECT <CUSTOM>

- Please help answer requirement 1, requirement 2, and requirement 3. And complete the table below to determine the price Rolland would quote for each option using the data table.arrow_forwardCan you provide samples/examples of tasks for developing the costing and profitability model for a new product? Should include the following: o A table showing the list of the parameters used in your model o A breakdown of the expected production costs and profitability o Calculation of the NPV of expected sales/ profitability o A sensitivity analysis that accounts for changes in any three (3) parameters of your model. o At least two trade-off rules you developed for your product developmentarrow_forwardIn Problem 22, if P(s1) = 0.25, P(s2) = 0.50, and P(s3) = 0.25, find a recommended decision for each of the three decision makers. (Note: For the same decision problem, different utilities can lead to different decisions.) 22. Three decision makers have assessed utilities for the following decision problem (payoff in dollars): The indifference probabilities are as follows: a. Plot the utility function for money for each decision maker. b. Classify each decision maker as a risk avoider, a risk taker, or risk-neutral. c. For the payoff of 20, what is the premium that the risk avoider will pay to avoid risk? What is the premium that the risk taker will pay to have the opportunity of the high payoff?arrow_forward
- Explain briefly what risk-neutral asset pricing is and how it is implemented in words to laymen. I cannot use jargon, algebra/equations, or diagrams. Ideally around 350 words?arrow_forwardThis question is for business math using the single trade discount and net price. Complete the following table: (Do not round intermediate calculations. Round your final answers to the nearest cent.) A treadmills list price is $3,000. Use the chain discount of 9/4 to get the net price and the single trade discount. Please explain how I work out both the single trade discount and the net price using the list price and the chain discount. So I can learn how to work out a problem like this for my midterm next week. For the net price, I got $180.00 but I am not sure if that is right.arrow_forwardWork the problem out by hand on a piece of paper so that you know what the answers should be. All dollar amounts (except EPS) should end in ",000" The schedule and statment in your output should compute mathematically from TOP to Bottom, so check and make sure that's the case Math Example: If A - B = C, then A - C = B and A = B + C Prepare an output section that produces the following items: 1) "COGS Schedule", 2) "Income Statement", and 3) "Retained Earning Statement". The reporting period is for the calendar year of 2023. The output items should be placed on a separate 'sheet' (the heading "... OUTPUT SECTION ..." should be centered over all columns to which it relates: [A1..G1]). Naming of the output 'sheet' should be "OUTPUT". No number (dollar amount, shares, or percentage) or company name should be typed (hard coded) directly into any cell in the output section, as this would prevent your output from being correct when the input is changed. Instead, the output section must…arrow_forward
- Using the data in E4-2 and spreadsheet software, determine: The variable cost per unit, the total fixed cost, and R2. The plotted data points using the graphing function. Compare the results to your solutions in E4-2 and E4-3 and explain the reasons for the results.arrow_forwardFind the price at which Aastha will get a margin call, and the price at which Brian will get a margin call.arrow_forwardThe Miramar Company is going to introduce one of three new products: a widget, a hummer, or a nimnot. The market conditions (favorable, stable, or unfavorable) will determine the profit or loss the company realizes, as shown in the following payoff table: a. Compute the expected value for each decision and select the best one. b. Develop the opportunity loss table and compute the expected opportunity loss for each product. c. Determine how much the firm would be willing to pay to a market research firm to gain better information about future market conditions.arrow_forward
- Consider a product market with three consumers A, B and C with demand function PA = 6 – QA, PB = 6 – 2QB and PC = 12 – QC respectively, where P is the price in dollars and QA, QB and QC are the quantities demanded by Consumer A, B and C respectively. The marginal cost of the product is constant at $4. (i) If the product is public good, analyse the product and determine the optimal quantity of the product in the market.(ii) How will your answer be different if the product is a private good instead?arrow_forwardConsider a product market with three consumers A, B and C with demand function PA = 6 – QA, PB = 6 – 2QB and PC = 12 – QC respectively, where P is the price in dollars and QA, QB and QC are the quantities demanded by Consumer A, B and C respectively. The marginal cost of the product is constant at $4. (i) If the product is public good, analyse the product and determine the optimal quantity of the product in the market.(ii) How will your answer be different if the product is a private good instead? (Hi there, may I requst for a detailed step by step explanation as i struggle with this topic. Thank you)arrow_forwardThe following payoff table shows profit for a decision analysis problem with two decision alternatives and three states of nature: State of Nature Decision Alternative S1 S2 S3 d1 200 150 150 d2 250 150 100 The probabilities for the states of nature are P(s1) = 0.55, P(s2) = 0.25, and P(s3) = 0.2. (a) What is the optimal decision strategy if perfect information were available? S1 : S2 : S3 : (b) What is the expected value for the decision strategy developed in part (a)? If required, round your answer to one decimal place. (c) Using the expected value approach, what is the recommended decision without perfect information? What is its expected value? If required, round your answer to one decimal place. (d) What is the expected value of perfect information? If required, round your answer to one decimal place.arrow_forward
 Principles of Cost AccountingAccountingISBN:9781305087408Author:Edward J. Vanderbeck, Maria R. MitchellPublisher:Cengage Learning
 Essentials Of Business AnalyticsStatisticsISBN:9781285187273Author:Camm, Jeff.Publisher:Cengage Learning,
 Essentials of Business Analytics (MindTap Course ...StatisticsISBN:9781305627734Author:Jeffrey D. Camm, James J. Cochran, Michael J. Fry, Jeffrey W. Ohlmann, David R. AndersonPublisher:Cengage Learning