
Statistics for Business & Economics
16th Edition
ISBN: 9781337325448
Author: Anderson
Publisher: CENGAGE C
expand_more
expand_more
format_list_bulleted
Concept explainers
Videos
Textbook Question
Chapter 20.2, Problem 3E
A large manufacturer purchases an identical component from three independent suppliers that differ in unit price and quantity supplied. The relevant data for 2012 and 2014 are given here.
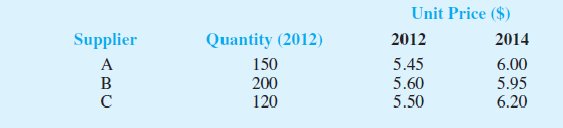
- a. Compute the price relatives for each of the component suppliers separately. Compare the price increases by the suppliers over the two-year period.
- b. Compute an unweighted aggregate price index for the component part in 2014.
- c. Compute a 2014 weighted aggregate price index for the component part. What is the interpretation of this index for the manufacturing firm?
Expert Solution & Answer

Trending nowThis is a popular solution!

Students have asked these similar questions
The following table gives the prices of some food items in the base year and current year and the quantities sold in the base year and current year. Commodity 2000 2005 Price (K) Quantity Price (K) Quantity A B C 15 20 4 15 5 10 22 27 7 12 4 5 Compute the following price index numbers for 2005 from the above table: i. Laspeyre’s price index number
ii. Paasche’s price index number
Determine the following
a) simple average of the price Indexes:
b) simple aggregate Index:
c) Lespeyres Price Index:
d) Paasche Price Index:
Use the following price information for selected items for 2010 and 2018. Production figures for those two periods are also given.
Price
Quantity
Item
2010
2018
2010
2018
Aluminum (cents per pound)
$
0.82
$
0.86
1,000
1,200
Natural gas $ per million BLA
4.37
2.99
5,000
4,000
Petroleum (barrel)
71.21
58.15
60,000
60,000
Platinum (troy ounce)
1,743.60
1,292.53
500
600
Determine Fisher's ideal index for 2018 using 2010 as the base period. (Round your answer to 2 decimal places.)
Chapter 20 Solutions
Statistics for Business & Economics
Ch. 20.2 - The following table reports prices and usage...Ch. 20.2 - An item with a price relative of 132 cost 10.75 in...Ch. 20.2 - A large manufacturer purchases an identical...Ch. 20.2 - Prob. 4ECh. 20.2 - Under the last-in, first-out (LIFO) inventory...Ch. 20.3 - Price relatives for three items, along with...Ch. 20.3 - The Mitchell Chemical Company produces a special...Ch. 20.3 - Prob. 8ECh. 20.3 - Compute the price relatives for the RB Beverages...Ch. 20.5 - Registered nurses in 2007 made an average hourly...
Ch. 20.5 - The average hourly wage rate for construction...Ch. 20.5 - Shipments of product from manufacturer to the...Ch. 20.5 - The revenue for Google for the years 2010-2014 is...Ch. 20.7 - Data on quantities of three items sold in Year 1...Ch. 20.7 - Prob. 15ECh. 20.7 - Prob. 16ECh. 20 - Many factors influence the retail price of...Ch. 20 - Nickerson Manufacturing Company has the following...Ch. 20 - Prob. 19ECh. 20 - Prob. 20ECh. 20 - Prob. 21ECh. 20 - Prob. 22ECh. 20 - Seafood price and quantity data are reported by...Ch. 20 - Prob. 24ECh. 20 - Prob. 25ECh. 20 - Prob. 26E
Knowledge Booster


Learn more about
Need a deep-dive on the concept behind this application? Look no further. Learn more about this topic, statistics and related others by exploring similar questions and additional content below.Similar questions
- Identify the control variable for each: 1) How successful is a particular educational program for alcohol abusers in reducing alcoholism? 2) What impact do gun registration laws have on homicide rates? 3) How have the payment limits for Medicare patients affected the health of senior citizens?arrow_forwardThe following data is given for Soweto Hospital with regards to the number of patients admitted in the first half of the year ended 30 June 2023 and the total costs incurred by the hospital to treat these patients in this period:MonthNumber of patients admittedTotal costs incurred by the hospital (Rands)January20050 000February20050 000March25055 000April25055 000May30060 000June15045 000Required:Calculate the variable cost per unit and total fixed costs by using the Least Squares (Simple Regression Analysis) method.arrow_forward) Consider the following figures showing the situation of the Australian labourmarket in 2018 (figures are per thousand and in percentage).Employed persons ('000) 12 620.7Unemployed persons ('000) 711.9Unemployment rate (%) 5.4Participation rate (%) 65.6a. What is the labour force participation rate? Briefly checking some online sources is it lower or higherthan in other countries? Try to provide some explanation for the difference.b. Assume that the participation rate in Australia changes to 63%, but the adult population and the numberof employed remain unchanged (hint: if the adult population is not reported, you can calculate it easilyfrom the labour force and participation rate). What would be the labour force, the number ofunemployed, and the unemployment rate?c. Go to the latest LFS by the ABS at: www.abs.gov.au/ausstats/abs@.nsf/mf/6202.0. How does the currentsituation compare with 2018? Spend about 10 minutes going through the website and report at least oneobservation you find…arrow_forward
- 3.24: The data in the accompanying table are from the Organization for Economic Co-operation and Development (data.oecd.org/eduatt/population-with-tertiary-education.htm, retrieved February 18, 2018). Entries in the table are the percentage of 25- to 34-year-old people who have completed a 4-year college degree for 27 countries in 2016. Country Percentage of people age 25 to 34 with 4-year degree Country Percentage of people age 25 to 34 with 4-year degree Australia 49.3 Italy 25.6 Austria 39.7 Japan 60.1 Canada 60.6 Mexico 21.8 Colombia 28.1 New Zealand 43.4 Costa Rica 28.9 Norway 48.6 Czech Republic 32.6 Poland 43.5 Denmark 45.9 Portugal 35.0 Finland 41.1 Spain 41.0 France 44.0 Sweden 47,.2 Germany 30.5 Switzerland 48.8 Greece 41.0 Turkey 30.5 Hungary 30.4 United Kingdom 52.0 Iceland 43.3 United States 47.5 Israel 47.4…arrow_forwardThe United States Census Bureau provided the following estimates and predic- tions for the total world population (* data from 2012, 2020-2050 numbers are predictions). Year Population 1950 2,556,518,868 1960 3,040,617,514 1970 3,707,921,742 1980 4,447,068,714 1990 5,274,320,491 2000 6,073,265,234 2010 6,838,220,183 2020* 7,608,075,253 2030* 8,295,925,812 2040* 8,897,180,403 2050* 9,404,296,384 Two major models used in predicting population growths are the Exponential Model P(t) = P0ert and the Logistic Model P(t) = k1 + be−ct Let t = 0 represent the year 1950 and plot the given dataset in a graph with viewing dimensions [−10, 110] for the x-coordinate and [0, 1010] for the y-coordinate. 1 In a paragraph discuss the properties of both models, then explain why one of the models fits the dataset better. Things you should touch upon in your explanations include but are not limited to: Assumptions being made by the model on the dataset, The behavior of the model with respect to the…arrow_forwardConsider the table. Sales on Toaster Ovens 2004 2005 2006 2007 2008 Super Deluxe $86,100 $140,500 $65,800 $56,100 $59,000 Deluxe 103,200 136,100 129,900 133,800 75,400 Standard 147,300 123,600 125,500 132,600 58,000 What percent of the total sales in 2004 were the deluxe model? (Round to the nearest tenth percent.)arrow_forward
- Following are the quantities and prices for the years 2010 and 2018 for Kinzua Valley Geriatrics. Use 2010 as the base period. 2010 2018ItemPriceQuantity PriceQuantitySyringes (dozen)$6.94 1,332 $6.18 1,957 Thermometers 8.32 5 16.38 15 Advil (bottle) 4.69 283 8.89 295 Patient record forms (box) 6.19 924 9.82 1,027 Copier paper (box) 10.48 55 25.96 81 %media:2excel.ext% Click here for the Excel Data File a. Determine the simple price indexes. (Round your answers to 2 decimal places.) b. Determine the simple aggregate price index for the two years. (Round your answer to 2 decimal places.) c. Determine the Laspeyres price index. (Round your answer to 2 decimal places.) d. Determine the Paasche price index. (Round your answer to 2 decimal places.) e. Determine Fisher's ideal index. (Round your answer to 2 decimal places.).arrow_forwardFollowing are the quantities and prices for the years 2010 and 2018 for Kinzua Valley Geriatrics. Use 2010 as the base period. 2010 2018 Item Price Quantity Price Quantity Syringes (dozen) 6.22 1,220 6.64 1,065 Thermometers 8.54 12 15.64 10 Advil (bottle) 3.05 370 6.39 341 Patient record forms (box) 7.13 1,194 11.36 1,505 Copier paper (box) 12.27 33 14.56 58 d. Determine the Paasche price index. (Round your answer to 2 decimal places.) e. Determine Fisher's ideal index. (Round your answer to 2 decimal places.)arrow_forwardIdentify the data collection method used in the following statements:1. A researcher investigates the influence of online payments on consumer spending.2. A local TV network asked the voters to indicate whom they voted as they exited the pollingbooth.3. The school administration asked the students whether they are willing to have an increase inlaboratory fees if there is an upgrade of computers.4. A social welfare organization gathers information on hospital patients with mental disorders.5. An investigator uses information from various business reports for analysis.arrow_forward
- Assuming the market research was done properly and the 40% is representative, how many sales are expected if the publisher attempts to sell to 5,000 homes?arrow_forwardThe following table presents prices, in thousands of dollars, of single-family homes for 20 of the largest metropolitan areas in the United States for the first quarter of 2012 and the first quarter of 2013. . Metro Area 2012 2013 Boston, MA 311.5 332.2 Chicago, IL 157.2 159.4 Cincinnati, OH 112.5 121.0 Cleveland, OH 84.9 101.0 Dallas, TX 148.2 160.4 Denver, CO 226.4 261.2 Houston, TX 152.1 163.7 Los Angeles, CA 122.1 155.1 Miami, FL 182.0 219.9 Minneapolis, MN 147.3 170.6 Metro Area 2012 2013 New York, NY 363.8 368.2 Philadelphia, PA 193.5 197.7 Phoenix, AZ 129.9 169.0 Portland, OR 208.6 246.5 Riverside, CA 174.3 216.7 St. Louis, MO 103.7 111.0 San Diego, CA 359.5 412.3 San Francisco, CA 448.0…arrow_forwardThe human papillomavirus associated with the development of cervical cancer, genital warts, and some less common cancers. John Hopkins conducted a study to investigate the characteristics of female patients who came to their clinics between 2006 and 2008 to begin the three-shot regimen of vaccinations with the anti-human papillomavirus (HPV) medication Gardasil. A contingency table summarizing the vaccine completions by race for 1222 patients is provided below. 1.State the null and alternative hypotheses. 2.Compute the test statistic. Compute the test statistic. Document how the expected counts and the value of the test statistic are computed and enter them into the table and input box provided. Round the expected counts to 3 decimal places and the test statistic to 2 decimal places. 3.Compute the p-value. Provide the name of the distribution and the parameters used to compute the p-value. Then enter your anwer rounded to 4 decimal places. 4.Interpret the results of the significance…arrow_forward
arrow_back_ios
SEE MORE QUESTIONS
arrow_forward_ios
Recommended textbooks for you
 MATLAB: An Introduction with ApplicationsStatisticsISBN:9781119256830Author:Amos GilatPublisher:John Wiley & Sons Inc
 Probability and Statistics for Engineering and th...StatisticsISBN:9781305251809Author:Jay L. DevorePublisher:Cengage Learning
 Statistics for The Behavioral Sciences (MindTap C...StatisticsISBN:9781305504912Author:Frederick J Gravetter, Larry B. WallnauPublisher:Cengage Learning
 Elementary Statistics: Picturing the World (7th E...StatisticsISBN:9780134683416Author:Ron Larson, Betsy FarberPublisher:PEARSON
 The Basic Practice of StatisticsStatisticsISBN:9781319042578Author:David S. Moore, William I. Notz, Michael A. FlignerPublisher:W. H. Freeman
 Introduction to the Practice of StatisticsStatisticsISBN:9781319013387Author:David S. Moore, George P. McCabe, Bruce A. CraigPublisher:W. H. Freeman
MATLAB: An Introduction with Applications
Statistics
ISBN:9781119256830
Author:Amos Gilat
Publisher:John Wiley & Sons Inc
Probability and Statistics for Engineering and th...
Statistics
ISBN:9781305251809
Author:Jay L. Devore
Publisher:Cengage Learning
Statistics for The Behavioral Sciences (MindTap C...
Statistics
ISBN:9781305504912
Author:Frederick J Gravetter, Larry B. Wallnau
Publisher:Cengage Learning
Elementary Statistics: Picturing the World (7th E...
Statistics
ISBN:9780134683416
Author:Ron Larson, Betsy Farber
Publisher:PEARSON
The Basic Practice of Statistics
Statistics
ISBN:9781319042578
Author:David S. Moore, William I. Notz, Michael A. Fligner
Publisher:W. H. Freeman
Introduction to the Practice of Statistics
Statistics
ISBN:9781319013387
Author:David S. Moore, George P. McCabe, Bruce A. Craig
Publisher:W. H. Freeman
Use of ALGEBRA in REAL LIFE; Author: Fast and Easy Maths !;https://www.youtube.com/watch?v=9_PbWFpvkDc;License: Standard YouTube License, CC-BY
Compound Interest Formula Explained, Investment, Monthly & Continuously, Word Problems, Algebra; Author: The Organic Chemistry Tutor;https://www.youtube.com/watch?v=P182Abv3fOk;License: Standard YouTube License, CC-BY
Applications of Algebra (Digit, Age, Work, Clock, Mixture and Rate Problems); Author: EngineerProf PH;https://www.youtube.com/watch?v=Y8aJ_wYCS2g;License: Standard YouTube License, CC-BY