
Concept explainers
Videos
Education Expenditure The following chart shows the percentage of the U.S. discretionary budget allocated to education from 2003 to 2009. (
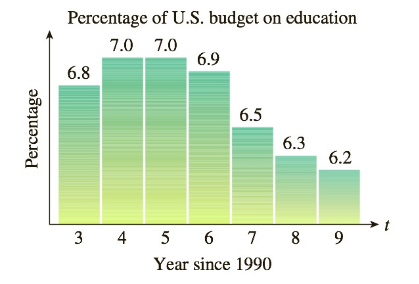
Source: www.globalissues.org/Geopolitics/ArmsTrade/Spending.asp
a. If you want to model the percentage figures with a function of the form
b. Which of the following models best approximates the data given? (Try to answer this without actually computing values.)
A.
B.
C.
D.
c. What is the nearest year that would correspond to the vertex of the graph of the correct model from part (b)? What is the danger of extrapolating the data in either direction?

Trending nowThis is a popular solution!

Chapter 2 Solutions
Applied Calculus


- High School Graduates The following table shows the number, in millions, graduating from high school in the United States in the given year. Year Number graduating in millions 1985 2.83 1987 2.65 1989 2.47 1991 2.29 a. By calculating difference, show that these data can be modeled using a linear function. b. What is the slope for the linear function modeling high school graduations? Explain in practical terms the meaning of the slope. c. Find a formula for a linear function that models these data. d. Express, using functional notation, the number graduating from high school in 1994, and then use your formula from part c to calculate that value.arrow_forwardTuition at American Public Universities This is a continuation of Exercise 6. The following table shows the average yearly in-state tuition and required fees, in dollars, charged by four-year American public universities in the school year ending in the given year. Date Average tuition 2012 8318 2013 8595 2014 8872 2015 9149 2016 9426 a. Show that these data can be modeled by a linear function, and find its formula. b. What is the slope for the linear function modeling tuition and required fees for public universities? c. What is the slope of the linear function modeling tuition and required fees for private universities? Note: See Exercise 6. d. Explain what the information in parts b and c tells you about the rate of increase in tuition in public versus private institutions. e. Which type of institution shows the larger percentage increase from 2015 to 2016? 6. Tuition at American Private Universities The following table shows the average yearly tuition and required fees, in dollars, charged by four-year American private nonprofit universities in the school year ending in the given year. Date Average tuition 2012 27, 870 2013 29, 004 2014 30, 138 2015 31, 272 2016 32, 406 a. Show that these data can be modeled by a linear function, and find its formula. b. Plot the data points and add the graph of the linear formula you found in part a. c. What prediction does this formula give for average tuition and fees at four-year American private nonprofit universities for the academic year ending in 2021?arrow_forwardPrice of Amazons Kindle The following table shows the price of Amazons Kindle 2 e-book reader. It is adapted from data available on the web. Here time is measured in months since February 2009, when the Kindle was launched. Time Price 0 349 5 299 10 249 15 199 a. By calculating differences, show that these data can be modeled using a linear function. b. Find a linear formula that models these data. Be careful about the sign of the slope. c. What price does your formula from part b project for January 2012 35 months after the Kindle was launched? Note: The web data were the basis for speculation that some day the Kindle would be free.arrow_forward
 Glencoe Algebra 1, Student Edition, 9780079039897...AlgebraISBN:9780079039897Author:CarterPublisher:McGraw Hill
 Functions and Change: A Modeling Approach to Coll...AlgebraISBN:9781337111348Author:Bruce Crauder, Benny Evans, Alan NoellPublisher:Cengage Learning
 Algebra & Trigonometry with Analytic GeometryAlgebraISBN:9781133382119Author:SwokowskiPublisher:Cengage
 Holt Mcdougal Larson Pre-algebra: Student Edition...AlgebraISBN:9780547587776Author:HOLT MCDOUGALPublisher:HOLT MCDOUGAL