Fundamentals of Statistics - With MyStatLab
5th Edition
ISBN: 9780134510149
Author: Sullivan
Publisher: PEARSON
expand_more
expand_more
format_list_bulleted
Videos
Textbook Question
Chapter 2.2, Problem 15AYU
Misery Index The following time-series plot shows the annual unemployment and inflation rates for the years 1992 through 2014. Source: www.miseryindex.us
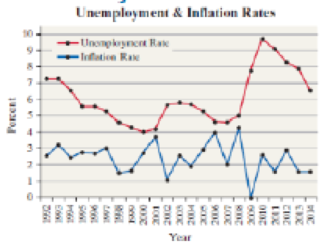
- a. Estimate the unemployment rate in 2011.
- b. In what year was the unemployment rate highest?
- c. In what year was the inflation rate highest?
- d. In what year were the unemployment rate and inflation rate closest? furthest?
- e. The misery index is defined as the sum of the unemployment rate and the inflation rate. According to the misery index, which year was more “miserable”, 1999 or 2014?
- f. Comment on the trend in the misery index since 2010.
Expert Solution & Answer
Want to see the full answer?
Check out a sample textbook solution
Students have asked these similar questions
Find the MSE in part (b) please.
Solve. If necessary, round to the nearest tenth of a percent.
The graph below shows the total earnings of the top 30 members of the Ladies Professional Golf Association (LPGA) golf tour. What was the percent decrease in total earnings between the
years 2009 and 2010?
%
35
31.6
28.8
30
-27.5
25.4
25
20
15
10
5
2007 2008 2009 2010
Total Earnings of Top 30 LPGA
Members
Dollars (in millions)
Fill in the blanks in the following table. Round your answers to 2 decimal places.
Chapter 2 Solutions
Fundamentals of Statistics - With MyStatLab
Ch. 2.1 - Define raw data in your own words.Ch. 2.1 - A frequency distribution lists the _____ of...Ch. 2.1 - In a relative frequency distribution, what should...Ch. 2.1 - What is a bar graph? What is a Pareto chart?Ch. 2.1 - Flu Season The pie chart shown, the type we see in...Ch. 2.1 - Cosmetic Surgery This USA Today type chart shows...Ch. 2.1 - Most Valuable Player The following Pareto chart...Ch. 2.1 - Poverty The U.S. Census Bureau uses money income...Ch. 2.1 - Divorce The following graph represents the results...Ch. 2.1 - Identity Theft Identity fraud occurs when someone...
Ch. 2.1 - Made in America A random sample of 2163 adults...Ch. 2.1 - Desirability Attributes A random sample of 2163...Ch. 2.1 - College Survey In a national survey conducted by...Ch. 2.1 - College Survey In a national survey conducted by...Ch. 2.1 - Use the Internet? The Gallup organization...Ch. 2.1 - Dining Out A sample of 521 adults was asked, How...Ch. 2.1 - NW Texting A survey of U.S. adults and teens (ages...Ch. 2.1 - Educational Attainment The educational attainment...Ch. 2.1 - Dream Job A survey of adult men and women asked,...Ch. 2.1 - Car Color A survey of 100 randomly selected autos...Ch. 2.1 - Prob. 21AYUCh. 2.1 - Bachelor Party In a survey conducted by Opinion...Ch. 2.1 - Favorite Day to Eat Out A survey was conducted by...Ch. 2.1 - Prob. 25AYUCh. 2.1 - Prob. 26AYUCh. 2.1 - Prob. 27AYUCh. 2.1 - StatCrunch Survey Choose a qualitative variable...Ch. 2.1 - Putting It Together: Online Homework Keeping...Ch. 2.1 - When should relative frequencies be used when...Ch. 2.1 - Prob. 31AYUCh. 2.1 - Prob. 32AYUCh. 2.1 - Prob. 33AYUCh. 2.2 - The categories by which data are grouped are...Ch. 2.2 - The _____ class limit is the smallest value within...Ch. 2.2 - The _____ is the difference between consecutive...Ch. 2.2 - Prob. 4AYUCh. 2.2 - Prob. 5AYUCh. 2.2 - Prob. 6AYUCh. 2.2 - True or False: The shape of the distribution shown...Ch. 2.2 - Prob. 8AYUCh. 2.2 - Rolling the Dice An experiment was conducted in...Ch. 2.2 - Car Sales A car salesman records the number of...Ch. 2.2 - IQ Scores The following frequency histogram...Ch. 2.2 - Alcohol-Related Traffic Fatalities The frequency...Ch. 2.2 - In Problems 13 and 14, for each variable...Ch. 2.2 - In Problems 13 and 14, for each variable...Ch. 2.2 - Misery Index The following time-series plot shows...Ch. 2.2 - Prob. 16AYUCh. 2.2 - Predicting School Enrollment To predict future...Ch. 2.2 - Free Throws In an experiment, a researcher asks a...Ch. 2.2 - In Problems 1922, determine the original set of...Ch. 2.2 - In Problems 1922, determine the original set of...Ch. 2.2 - In Problems 1922, determine the original set of...Ch. 2.2 - In Problems 1922, determine the original set of...Ch. 2.2 - find (a) the number of classes, (b) the class...Ch. 2.2 - Earthquakes The following data represent the...Ch. 2.2 - In Problems 25 and 26, construct (a) a relative...Ch. 2.2 - In Problems 25 and 26, construct (a) a relative...Ch. 2.2 - NW Televisions in the Household A researcher with...Ch. 2.2 - Waiting The data below represent the number of...Ch. 2.2 - NW Gini Index The Gini Index is a measure of how...Ch. 2.2 - Average Income The following data represent the...Ch. 2.2 - Cigarette Tex Rates The table shows the tax, in...Ch. 2.2 - Dividend Yield A dividend is a payment from a...Ch. 2.2 - NW Violent Crimes Violent crimes include murder,...Ch. 2.2 - Volume of Altria Group Stock The volume of a stock...Ch. 2.2 - Prob. 35AYUCh. 2.2 - Prob. 36AYUCh. 2.2 - Prob. 37AYUCh. 2.2 - Prob. 38AYUCh. 2.2 - Prob. 39AYUCh. 2.2 - Prob. 40AYUCh. 2.2 - NW Violent Crimes Use the violent crime rate data...Ch. 2.2 - Academy Award Winners The following data represent...Ch. 2.2 - Prob. 43AYUCh. 2.2 - Sullivan Survey Choose a continuous quantitative...Ch. 2.2 - Prob. 46AYUCh. 2.2 - Prob. 47AYUCh. 2.2 - Waiting Draw a dot plot of the waiting data from...Ch. 2.2 - Prob. 49AYUCh. 2.2 - Prob. 50AYUCh. 2.2 - Prob. 51AYUCh. 2.2 - Prob. 52AYUCh. 2.2 - Prob. 53AYUCh. 2.2 - Putting It Together: Which Graphical Summary?...Ch. 2.2 - Prob. 55AYUCh. 2.2 - Prob. 56AYUCh. 2.2 - Discuss the advantages and disadvantages of...Ch. 2.2 - Prob. 58AYUCh. 2.2 - Describe the situations in which it is preferable...Ch. 2.2 - Sketch four histogramsone skewed right, one skewed...Ch. 2.2 - What type of variable is required when drawing...Ch. 2.3 - Inauguration Cost The following is a USA...Ch. 2.3 - Burning Calories The following is a USA Today-type...Ch. 2.3 - NW Median Earnings The graph shows the median...Ch. 2.3 - Union Membership The following relative frequency...Ch. 2.3 - NW Robberies A newspaper article claimed that the...Ch. 2.3 - Car Accidents An article in a student newspaper...Ch. 2.3 - Tax Revenue The following histogram drawn in...Ch. 2.3 - You Explain It! Oil Reserves The U.S. Strategic...Ch. 2.3 - NW Cost of Kids The following is a USA Today-type...Ch. 2.3 - Worker Injury The safety manager at Klutz...Ch. 2.3 - Health Care Expenditures The following data...Ch. 2.3 - Prob. 12AYUCh. 2.3 - NW Overweight Between 1980 and 2012, the number of...Ch. 2.3 - Ideal Family Size The following USA Today-type...Ch. 2.3 - National League Baseball MVP The following pie...Ch. 2.3 - Prob. 16AYUCh. 2 - Effective Commercial Harris Interactive conducted...Ch. 2 - Weapons Used in Homicide The following frequency...Ch. 2 - Live Births The following frequency distribution...Ch. 2 - Political Affiliation One hundred randomly...Ch. 2 - Family Size A random sample of 60 couples married...Ch. 2 - Home Ownership Rates The table shows the home...Ch. 2 - Diameter of a Cookie The following data represent...Ch. 2 - Time Online The following data represent the...Ch. 2 - Grade Inflation The side-by-side bar graph to the...Ch. 2 - Income Distribution The following data represent...Ch. 2 - Misleading Graphs In 2013, the average earnings of...Ch. 2 - High Heels The graphic to the right is a USA Today...Ch. 2 - The graph shows the ratings on Yelp for Hot Dougs...Ch. 2 - A random sample of 1005 adult Americans was asked,...Ch. 2 - Interested in knowing the educational background...Ch. 2 - The following data represent the number of cars...Ch. 2 - Dr. Paul Oswiecmiski randomly selects 40 of his...Ch. 2 - The following data represent the time (in minutes)...Ch. 2 - The data below shows birth rate and per capita...Ch. 2 - The following is a USA Today-type graph. Do you...Ch. 2 - A bar graph or pie chart (or both) that depicts...Ch. 2 - A histogram that displays the distribution of...Ch. 2 - Six histograms displaying tornado duration for...Ch. 2 - A bar chart that shows the relationship between...Ch. 2 - A bar chart that shows the relationship between...Ch. 2 - A general summary of your findings and...
Knowledge Booster


Learn more about
Need a deep-dive on the concept behind this application? Look no further. Learn more about this topic, statistics and related others by exploring similar questions and additional content below.Similar questions
- DVD Player sales The table shows the number of DVD play-ers sold in a small electronics store in the years 2003-2013. What was the average rate of change of sales between 2003 and 2013? Whatwas the average rate of change of sales between 2003 and 2004? What was the average rate of change of sales between 2004 and 2005? Between which two successive years did DVD player sales increase most quickly?arrow_forwardThe side-by-side bar graph available below shows the approximate average grade point average for the years 1991-1992, 1996-1997, 2001-2002, and 2006-2007 for colleges and universities. Complete parts (a) through (c) below. Click the icon to view the side-by-side bar graph. (a) Does the graph suggest that grade inflation is a problem in colleges? A. Yes, because the GPAS increased over time for all schools. B. No, because nothing can be concluded about individual GPAS from the averages. C. No, because the GPAS are different for each time period. D. Yes, because the GPAS are greater for private schools for every time period. (b) In public schools, the average GPA was 2.86 in 1991-1992 and 3.02 in 2006-2007. In private schools, the average GPA was 3.09 in 1991-1992 and 3.30 in 2006-2007. Determine the percentage increase in GPAs for public schools from 1991 to 2006. Determine the percentage increase in GPAs for private schools from 1991 to 2006. Which type of institution appears to have…arrow_forwardPlease solve all the questions belowarrow_forward
- The table lists how Financial aid and come cut off‘s in dollars for a family of four have changed over time. Use the midpoint formula to approximate the financial aid cut off for 1985. Year Income 1960. 21,250 1970. 27,500 1980. 33,750 1990. 40,000 2000. 46,250arrow_forwardMan.8arrow_forwardThe population of Ada County, Idaho has been steadily increasing for more than 20 years. The table below shows the population (people) from 2015 through 2019 in Ada County. year 2015 2016 2017 2018 2019 population 432,862 444,486 456,548 468,764 481,587 a. What is the average rate of change in the population of Ada County from 2015 to 2018? Round to the nearest whole person and include units. b. What is the average rate of change in the population of Ada County from 2016 to 2018? Round to the nearest whole person and include units. c. What is the average rate of change in the population of Ada County from 2017 to 2018? Round to the nearest whole person and include units. d. What is the average rate of change in the population of Ada County from 2018 to 2019? Round to the nearest whole person and include units. e. Give a good approximation for the rate at which the population of Ada County is growing by the end of 2018? Round to the nearest whole person and include units.arrow_forward
- In 2011 home prices and mortgage rates dropped so low that in a number of cities the monthly cost of owning a home was less expensive than renting. The following data show the average asking rent for 10 markets and the monthly mortgage on the median priced home (including taxes and insurance) for 10 cities where the average monthly mortgage payment was less than the average asking rent (The Wall Street Journal, November 26–27, 2011).Click on the datafile logo to reference the data. Enter negative values as negative numbers. a. Develop the estimated regression equation that can be used to predict the monthly mortgage given the average asking rent (to 2 decimals).The regression equation is:Mortgage ($) = + Rent ($)arrow_forwardThe creator of a new online multiplayer survival game has been tracking the monthly downloads of the game. The following table shows the monthly downloads (in thousands) for each month of the current and previous year. Click on the datafile logo to reference the data. The datafile logo. Month Downloads Month Downloads (previous year) (thousands) (current year) (thousands) February 33.0 January 31.0 March 34.0 February 32.0 April 34.0 March 33.0 May 31.0 April 34.0 June 32.0 May 33.0 July 33.0 June 32.0 August 35.0 July 35.0 September 36.0 August 33.0 October 37.0 September 33.0 November 34.0 October 31.0 December 35.0 a. Compute the mean, median, and mode for number of downloads in the previous year. Mean (to 3 decimals) thousand Median (to 2 decimal) thousand Mode (to 2 decimal) thousand b. Compute the mean, median, and mode for number of downloads in the current year. Mean (to 3 decimals) thousand Median (to 2…arrow_forwardJohn Kittle, an independent insurance agent, uses a five-year moving average to forecast the number of claims made in a single year for one of the large insurance companies he sells for. He has just discovered that a clerk in his employ incorrectly entered the number of claims made four years ago as 1,400 when it should have been 1,200.a. What adjustment should Mr. Kittle make in next year’s forecast to take into account the corrected value of the number of claims four years ago?b. Suppose that Mr. Kittle used simple exponential smoothing with a = .2instead of moving averages to determine his forecast. What adjustment is now required in next year’s forecast? (Note that you do not need to know the value of the forecast for next year in order to solve this problem.)arrow_forward
- Meat and gasoline are two important components of the household budget in typical American homes, especially in lower income households. The figure below shows the evolution of average prices for Ground beef (per pound) and Gasoline (per gallon) for the 2001-2021 period in the United States. Average price data (in U.S. dollars), selected items Bananas, per lb. Bread, white, pan, per lb.. Chicken, fresh, whole, per lb. Eggs, grade A, large, per doz. Ground chuck, 100% beef, per lb. - Milk, fresh, whole, fortified, per gal. $6.00 $4.00 Lampions $2.00 $0.00 Aug 2001 Aug 2003 ...... A Aug 2005 Oranges, Navel, per lb. Tomatoes, field grown, per lb. Electricity per KWH Gasoline, unleaded regular, per gallon Utility (piped) gas per therm Aug 2007 Mummy Aug 2009 Aug 2011 Aug 2013 Aug 2015 Aug 2017 Aug 2019 Aug 2021 Hover over chart to view data. Note Shaded area represents recession, as determined by the National Bureau of Economic Research.. Source US. Bureau of Labor Statistics. Figure 1.…arrow_forwardMake sure to do the rounding and double check the answers please.arrow_forwardMake sure to do the rounding and double check the Answers please.arrow_forward
arrow_back_ios
SEE MORE QUESTIONS
arrow_forward_ios
Recommended textbooks for you
 Algebra and Trigonometry (MindTap Course List)AlgebraISBN:9781305071742Author:James Stewart, Lothar Redlin, Saleem WatsonPublisher:Cengage Learning
 College AlgebraAlgebraISBN:9781305115545Author:James Stewart, Lothar Redlin, Saleem WatsonPublisher:Cengage Learning
 Mathematics For Machine TechnologyAdvanced MathISBN:9781337798310Author:Peterson, John.Publisher:Cengage Learning,
 College Algebra (MindTap Course List)AlgebraISBN:9781305652231Author:R. David Gustafson, Jeff HughesPublisher:Cengage Learning
 Glencoe Algebra 1, Student Edition, 9780079039897...AlgebraISBN:9780079039897Author:CarterPublisher:McGraw Hill
Algebra and Trigonometry (MindTap Course List)
Algebra
ISBN:9781305071742
Author:James Stewart, Lothar Redlin, Saleem Watson
Publisher:Cengage Learning
College Algebra
Algebra
ISBN:9781305115545
Author:James Stewart, Lothar Redlin, Saleem Watson
Publisher:Cengage Learning
Mathematics For Machine Technology
Advanced Math
ISBN:9781337798310
Author:Peterson, John.
Publisher:Cengage Learning,
College Algebra (MindTap Course List)
Algebra
ISBN:9781305652231
Author:R. David Gustafson, Jeff Hughes
Publisher:Cengage Learning
Glencoe Algebra 1, Student Edition, 9780079039897...
Algebra
ISBN:9780079039897
Author:Carter
Publisher:McGraw Hill
Time Series Analysis Theory & Uni-variate Forecasting Techniques; Author: Analytics University;https://www.youtube.com/watch?v=_X5q9FYLGxM;License: Standard YouTube License, CC-BY
Operations management 101: Time-series, forecasting introduction; Author: Brandoz Foltz;https://www.youtube.com/watch?v=EaqZP36ool8;License: Standard YouTube License, CC-BY