
Videos
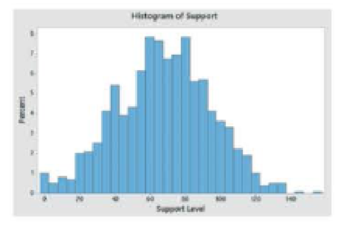
Corporate sustainability of CPA firms. Refer to the Business and Society (March 2011) study on the sustainability behaviors of CPA corporations, Exercise 1.28 (p. 27). Corporate sustainability, recall, refers to business practices designed around social and environmental considerations. Data on the level of support for corporate sustainability were obtained for 992 senior managers. Level of support was measured quantitatively. Simulation was used to convert the data from the study to a scale
- a. A histogram for level of support for sustainability is shown next. What type of histogram is produced, frequency or relative frequency?
- b. Use the graph to estimate the percentage of the 992 senior managers who reported a high (1 00 points or greater) level of support for corporate sustainability. Minitab histogram for Exercise 2.23
Want to see the full answer?
Check out a sample textbook solution
Chapter 2 Solutions
Statistics for Business and Economics (13th Edition)
Additional Math Textbook Solutions
Intro Stats, Books a la Carte Edition (5th Edition)
Statistics for Engineers and Scientists
Elementary Statistics


- Downs and Abwender (2002) evaluated soccer players and swimmers to determine whether the routine blows to the head experienced by soccer players produced long-term neurological deficits. In the study, neurological tests were administered to mature soccer players and swimmers and the results indicated significant differences. In a similar study, a researcher obtained the following data. Are the neurological test scores significantly lower for the soccer players than for the swimmers in the control group? Use a one-tailed test with a= .05. Compute the value of r2(percentage of variance accounted for) for these data.arrow_forwardA researcher is interested in gender differences in attitudes toward dating. Specifically, she wants to test the hypothesis that women are more accepting than men are of the idea that men should always pay on the first date, and thus women should have a more traditional view of dating than men do. Data are collected from 10 women and 10 men using a scale that measures dating behaviors and attitudes. Higher scores mean more traditional dating attitudes. Answer the following: 1) What are the independent and dependent variables in this study? 2) What inferential statistic discussed thus far could be used to answer this question? 3) Discuss your process of answering questions one and two.arrow_forwardMcAllister, et al. (2012) compared varsity football and hockey players with varsity athletes from noncontact sports to determine whether exposure to head impacts during one season have an effect on cognitive performance. In the study, tests of new learning performance were significantly poorer for the contact sport athletes compared to the noncontact sport athletes. The following table presents data similar to the results obtained in the study. Noncontact Athletes Contact Athletes 10 7 8 4 7 9 9 3 13 7 7 6 6 10 12 2 Are the neurological test scores significantly lower for the contact athletes than for the noncontact athletes in the control group? Use a one-tailed test with α = .05. Compute the value of r² (percentage of variance accounted for) for these data.arrow_forward
- An industrial/organizational psychologist has been consulting with a company that runs weekend job-seeking workshops for the unemployed. She collected data on several issues related to these workshops and, after conducting statistical tests, obtained statistically significant findings. She needs to find a way to evaluate effect size so that she can make recommendations to the company. One of the psychologist's findings is that 18 months after the workshop, a sample of 81 job seekers who received training on setting career goals worked more than 30 hours per week an average of 8. 7 months in the last year, with a standard deviation of 4.1. The typical job seeker works 7.4 months. r2= ____ (three decimals)arrow_forwardA study compared tooth health and periodontal damage in a group of 40 young adult males with a tongue piercing and a control group of 50 young adult males without tongue piercing. Here are the summary statistics: Group Sample size Mean of enamel cracks StDev of enamel cracks Tongue piercing 40 4.1 3.7 No Tongue piercing 50 1.3 1.6 One question of interest was whether individuals with tongue piercing had more enamel cracks, on average. Is there evidence at 1% level that young adult males with a tongue piercing have significantly more enamel cracks than young adult males without a tongue piercing? Which method will you use to perform the test? Choose the correct one. 1-sample T test 2-sample T test 2-sample Z test. 2-proportion Z test Which distribution will you use here? If you use t distribution, give the degree of freedom. If you use z or normal, give the mean and standard deviation.arrow_forward
 Glencoe Algebra 1, Student Edition, 9780079039897...AlgebraISBN:9780079039897Author:CarterPublisher:McGraw Hill
 Big Ideas Math A Bridge To Success Algebra 1: Stu...AlgebraISBN:9781680331141Author:HOUGHTON MIFFLIN HARCOURTPublisher:Houghton Mifflin Harcourt