
Concept explainers
Videos
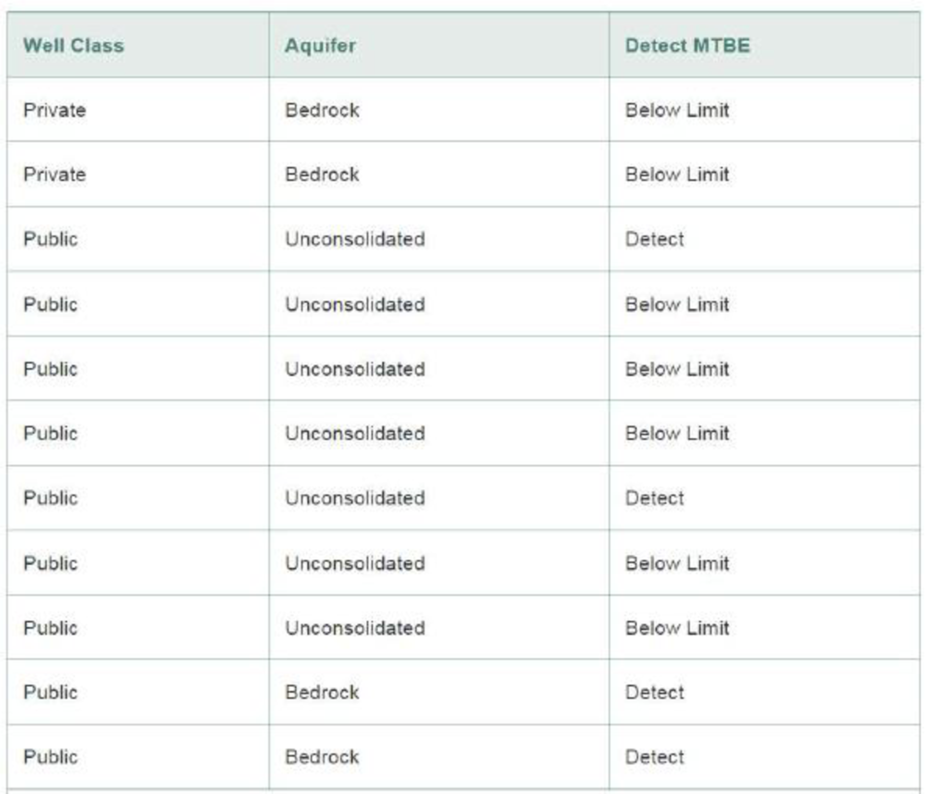
Groundwater contamination in wells. In New Hampshire, about half the counties mandate the use of reformulated gasoline. This has led to an increase in the contamination of groundwater with methyl tert-butyl ether (MTBE). Environmental Science & Technology (Jan. 2005) reported on the factors related to MTBE contamination in public and private New Hampshire wells. Data were collected for a sample of 223 wells. Three of the variables are qualitative in nature: well class (public or private), aquifer (bedrock or unconsolidated), and detectible level of MTBE (below limit or detect). [Note: A detectible level of MTBE occurs if the MTBE value exceeds .2 micrograms per liter.] The data for 11 selected wells are shown in the accompanying table.
- a. Use graphical methods to describe each of the three qualitative variables for all 223 wells.
- b. Use side-by-side bar charts to compare the proportions of contaminated wells for private and public well classes.
- c. Use side-by-side bar charts to compare the proportions of contaminated wells for bedrock and unconsolidated aquifers.
- d. What inferences can be made from the bar charts, parts a-c?
Want to see the full answer?
Check out a sample textbook solution
Chapter 2 Solutions
Statistics for Business and Economics (13th Edition)


- Urban Travel Times Population of cities and driving times are related, as shown in the accompanying table, which shows the 1960 population N, in thousands, for several cities, together with the average time T, in minutes, sent by residents driving to work. City Population N Driving time T Los Angeles 6489 16.8 Pittsburgh 1804 12.6 Washington 1808 14.3 Hutchinson 38 6.1 Nashville 347 10.8 Tallahassee 48 7.3 An analysis of these data, along with data from 17 other cities in the United States and Canada, led to a power model of average driving time as a function of population. a Construct a power model of driving time in minutes as a function of population measured in thousands b Is average driving time in Pittsburgh more or less than would be expected from its population? c If you wish to move to a smaller city to reduce your average driving time to work by 25, how much smaller should the city be?arrow_forwardIn the book Business Research Methods (5th ed.), Donald R. Cooper and C. William Emory discuss studying the relationship between on-the-job accidents and smoking. Cooper and Emory describe the study as follows: Suppose a manager implementing a smoke-free workplace policy is interested in whether smoking affects worker accidents. Since the company has complete reports of on-the-job accidents, she draws a sample of names of workers who were involved in accidents during the last year. A similar sample from among workers who had no reported accidents in the last year is drawn. She interviews members of both groups to determine if they are smokers or not. The sample results are given in the following table. On-the-Job Accident Smoker Yes No Row Total Heavy 12 5 17 Moderate 9 10 19 Nonsmoker 13 17 30 Column total 34 32 66 Expected counts are below observed counts Accident No Accident Total Heavy 12 5 17 8.76 8.24…arrow_forwardA cross-sectional study is conducted to investigate cardiovascular disease (CVD) risk factors among a sample of patients seeking medical care at one of three local hospitals. A total of 500500 patients are enrolled. Based on the following data, we would like to determine if there is a significant association between the family history of CVD and the enrollment site. Enrollment Site Family History of CVD Hospital 1 Hospital 2 Hospital 3 Total Yes 34 8 58 100 No 104 72 224 400 Total 138 80 282 500 Given: The value of the test statistic is χ2= 6.912 Use α=0.1 as the level of significance. The superintendent of Hospital 2 performed the Goodness of Fit Test to test whether 25% of the patients go to Hospital 1, 15% of the patients go to Hospital 2 and 60% of the patients go to Hospital 3. Given: The superintendent found that the pp-value for the test is 0.25091 Let: p1=p1= be the proportion of patients at Hospital 1 p2=p2= be the proportion of patients at…arrow_forward
- Eighteen participants took part in an experimental study that consisted of three levels: normal classroom teaching, normal classroom teaching with tutors, and an experimental teaching method to increase student scores on a statistics exam. Your data set includes the following variables: Treatment (1 - normal classroom teaching; 2 - normal classroom teaching with tutors; 3 - experimental teaching method) Gender (1 – female; 2 – male) Pre-test score (higher scores represent better student performance on a statistics exam) Post-test score (higher scores represent better student performance on a statistics exam) Stanford-Binet Intelligence Test scores (IQ) The number of hours the student studied per week. Do test scores at pre-treatment differ from test scores at post-treatment? Note, this analysis should be conducted ignoring the treatment group they are in. Select an appropriate statistical test and state teh hullhypothesis.arrow_forwardA low-level CDC bureaucrat wants to please his boss by gathering evidence thatthe current government-mandated shutdown of society is not causing people’s mentalhealth to deteriorate, so that it can safely be continued for several years if anyexpert says it’s necessary.He polls a random sample of 1600 citizens, gathering data on such items asincome loss, weight gain, access to toilet paper, hours spent binge-watchingNetflix, and number of injuries caused by household fights, and compiles all thisinto a scientifically-weighted “misery index”.The mean misery index from the sample is 99.2; it seems reasonable to use apopulation standard deviation σ = 19.1.a) Does this information provide significant evidence (at the 5% level) that thenationwide mean misery index is less than 100? Set up appropriate null andalternative hypotheses, calculate the appropriate test statistic, find the P-value,and state your conclusion. (10)b) A CDC press release publishing the results of this study claims that…arrow_forwardA low-level CDC bureaucrat wants to please his boss by gathering evidence thatthe current government-mandated shutdown of society is not causing people’s mentalhealth to deteriorate, so that it can safely be continued for several years if anyexpert says it’s necessary.He polls a random sample of 1600 citizens, gathering data on such items asincome loss, weight gain, access to toilet paper, hours spent binge-watchingNetflix, and number of injuries caused by household fights, and compiles all thisinto a scientifically-weighted “misery index”.The mean misery index from the sample is 99.2; it seems reasonable to use apopulation standard deviation σ = 19.1.a) Does this information provide significant evidence (at the 5% level) that thenationwide mean misery index is less than 100? Set up appropriate null andalternative hypotheses, calculate the appropriate test statistic, find the P-value,and state your conclusion. b) A CDC press release publishing the results of this study claims that…arrow_forward
- Suppose that, as part of a research methods class, Bailey was asked to write a summary of a research paper on the topic of the effects of oil contamination in soil on seed germination rates. Identify the explanatory and the response variables.arrow_forwardThe government sample survey of 60,000 households each month that produces data on employment, earnings, and many other variables is called the A. General Household Survey. B. Gallup Poll. C. Labor Statistics Survey. D. General Social Survey. E. Current Population Survey.arrow_forward
 Functions and Change: A Modeling Approach to Coll...AlgebraISBN:9781337111348Author:Bruce Crauder, Benny Evans, Alan NoellPublisher:Cengage Learning
 Glencoe Algebra 1, Student Edition, 9780079039897...AlgebraISBN:9780079039897Author:CarterPublisher:McGraw Hill
 Big Ideas Math A Bridge To Success Algebra 1: Stu...AlgebraISBN:9781680331141Author:HOUGHTON MIFFLIN HARCOURTPublisher:Houghton Mifflin Harcourt