
Statistics for Business and Economics (13th Edition)
13th Edition
ISBN: 9780134506593
Author: James T. McClave, P. George Benson, Terry Sincich
Publisher: PEARSON
expand_more
expand_more
format_list_bulleted
Videos
Textbook Question
Chapter 2.3, Problem 2.45ACB
Performance-based logistics. Refer to the Journal of Business Logistics (Vol. 36, 2015) study of the factors that lead to successful performance-based logistics (PBL) projects , Exercise 1.15 (p. 25). Recall that opinions of a sample of 17 Department of Defense employees and suppliers were solicited during interviews. Demographics (current position, organization type, experience) were recorded for each interviewee and the data listed in the table below.
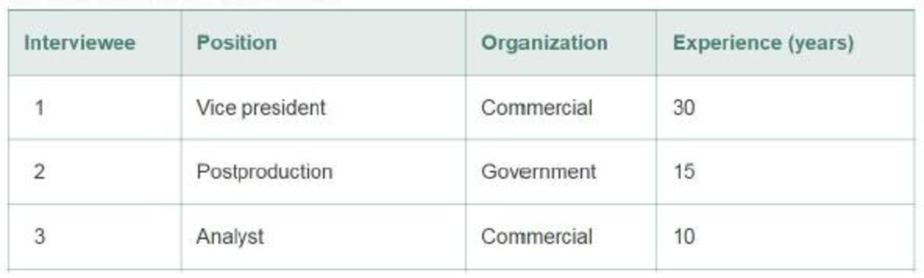
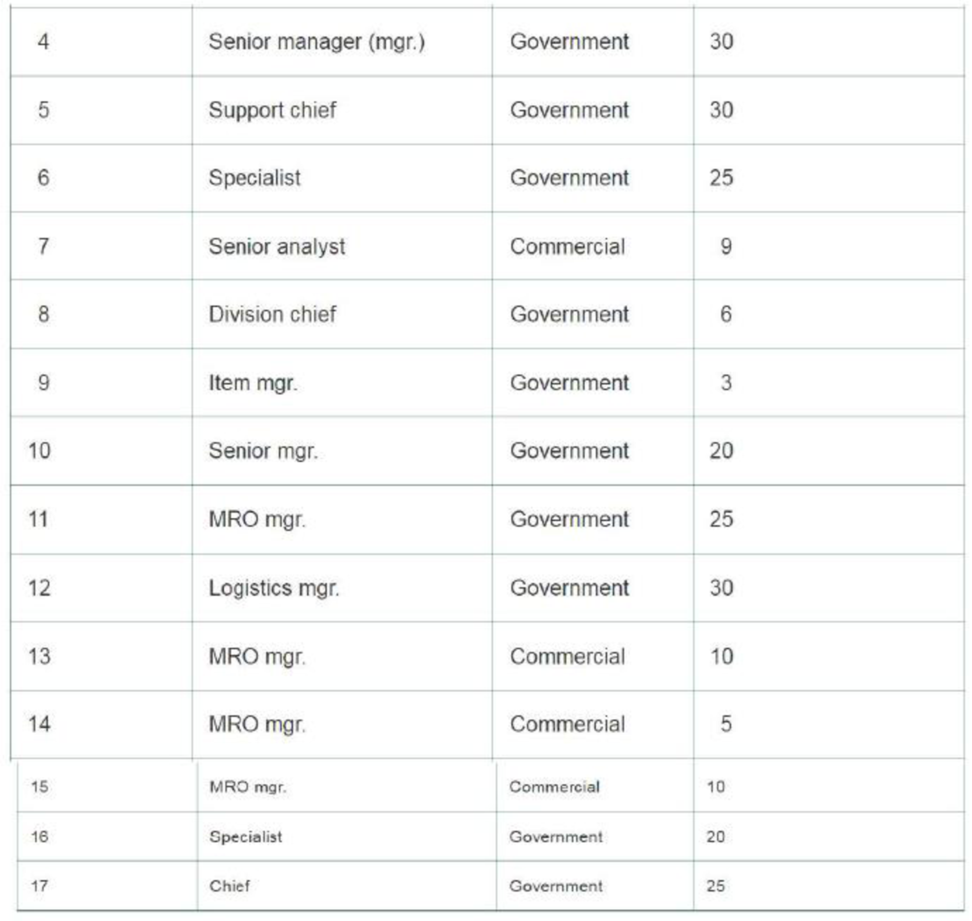
- a. Find and interpret the mean years of experience for the 17 interviewees.
- b. Find and interpret the median years of experience for the 17 interviewees.
- c. Find and interpret the
mode of the 17 years of experience values.
Expert Solution & Answer
Want to see the full answer?
Check out a sample textbook solution
Students have asked these similar questions
Based on a survey of 12,344 U.S. college students and 6,729 Canadian college students, Kuo, Adlaf, Lee, Gliksman, Demers, and Wechsler (2002) report that alcohol use is more common among Canadian than U.S. students, but heavy drinking (five or more drinks in a row for males, four or more for females) is significantly higher among U.S. students than Canadian students.
Is this an example of a survey research design?
The Behavioral Risk Factor Surveillance System (BRFSS) is an annual telephone survey designed to identify risk factors in the adult population and reportemerging health trends. The following table summarizes two variables for the respondents: health status and health coverage, which describes whether each respondent had health insurance:
Health Status
Excellent
Very Good
Good
Fair
Poor
Total
Health
No
459
727
854
385
99
2524
Coverage
Yes
4198
6245
4821
1634
578
17476
Total
4657
6972
5675
2019
677
20000
If we draw one individual at random, what is the probability that the respondent has health coverage if they have good health?
Answer with a decimal rounded to 3 decimal places.
In the book Business Research Methods (5th ed.), Donald R. Cooper and C. William Emory discuss studying the relationship between on-the-job accidents and smoking. Cooper and Emory describe the study as follows:
Suppose a manager implementing a smoke-free workplace policy is interested in whether smoking affects worker accidents. Since the company has complete reports of on-the-job accidents, she draws a sample of names of workers who were involved in accidents during the last year. A similar sample from among workers who had no reported accidents in the last year is drawn. She interviews members of both groups to determine if they are smokers or not.
The sample results are given in the following table.
On-the-Job Accident
Smoker
Yes
No
Row Total
Heavy
12
5
17
Moderate
9
10
19
Nonsmoker
13
17
30
Column total
34
32
66
Expected counts are below observed counts
Accident
No Accident
Total
Heavy
12
5
17
8.76
8.24…
Chapter 2 Solutions
Statistics for Business and Economics (13th Edition)
Ch. 2.1 - Complete the following table.Ch. 2.1 - A qualitative variable with three classes (X, Y,...Ch. 2.1 - STEM experiences for girls. The National Science...Ch. 2.1 - Cable TV subscriptions and cord cutters. Has the...Ch. 2.1 - Do social robots walk or roll? A social (or...Ch. 2.1 - Top credit card issuers, by region. The Nilson...Ch. 2.1 - Microsoft program security issues. To help its...Ch. 2.1 - Jamming attacks on wireless networks. Refer to the...Ch. 2.1 - The Apprentice contestants performance ratings....Ch. 2.1 - The economic return to earning an MBA. Refer to...
Ch. 2.1 - Profiling UK rental malls. An analysis of the...Ch. 2.1 - History of corporate acquisitions. A corporate...Ch. 2.1 - Twitter opinions of iPhone 6 features. What are...Ch. 2.1 - Museum management. What criteria do museums use to...Ch. 2.1 - Advertising with reader-response cards....Ch. 2.1 - Motivation and right-oriented bias. Evolutionary...Ch. 2.1 - Groundwater contamination in wells. In New...Ch. 2.2 - Graph the relative frequency histogram for the 500...Ch. 2.2 - Refer to Exercise 2.18. Calculate the number of...Ch. 2.2 - Consider the stem-and-leaf display shown here. a....Ch. 2.2 - Minitab was used to generate the following...Ch. 2.2 - Stability of compounds in new drugs. Testing the...Ch. 2.2 - Corporate sustainability of CPA firms. Refer to...Ch. 2.2 - Sanitation inspection of cruise ships. To minimize...Ch. 2.2 - History of corporate acquisitions. Refer to the...Ch. 2.2 - Most valuable NFL teams. Each year Forbes reports...Ch. 2.2 - State SAT scores. Educators are constantly...Ch. 2.2 - Items arriving and departing a work center. In a...Ch. 2.2 - Crude oil biodegradation. In order to protect...Ch. 2.2 - Volkswagen emissions scandal. Recently, the...Ch. 2.2 - Is honey a cough remedy? Does a teaspoon of honey...Ch. 2.2 - Time in bankruptcy. Financially distressed firms...Ch. 2.2 - Prob. 2.33ACACh. 2.2 - Prob. 2.34ACACh. 2.3 - Calculate the mean and median of the following...Ch. 2.3 - Calculate the mean for samples where a. n = 10, x...Ch. 2.3 - Explain how the relationship between the mean and...Ch. 2.3 - Explain the difference between the calculation of...Ch. 2.3 - Calculate the mode, mean, and median of the...Ch. 2.3 - Calculate the mean, median, and mode for each of...Ch. 2.3 - Describe how the mean compares to the median for a...Ch. 2.3 - Use the applet entitled Mean versus Median to find...Ch. 2.3 - Prob. 2.2AECh. 2.3 - Use the applet Mean versus Median to study the...Ch. 2.3 - Hotels use of ecolabels. Ecolabels such as Energy...Ch. 2.3 - Rankings of research universities. Based on...Ch. 2.3 - Performance of stock screeners. Investment...Ch. 2.3 - Performance-based logistics. Refer to the Journal...Ch. 2.3 - Surface roughness of oil field pipe. Oil field...Ch. 2.3 - Prob. 2.47ACICh. 2.3 - Corporate sustainability of CPA firms. Refer to...Ch. 2.3 - Is honey a cough remedy? Refer to the Archives of...Ch. 2.3 - Crude oil biodegradation. Refer to the Journal of...Ch. 2.3 - Symmetric or skewed? Would you expect the data...Ch. 2.3 - Prob. 2.52ACICh. 2.3 - Prob. 2.53ACACh. 2.3 - Prob. 2.54ACACh. 2.3 - Prob. 2.55ACACh. 2.4 - Answer the following questions about variability...Ch. 2.4 - Calculate the range, variance, and standard...Ch. 2.4 - Calculate the variance and standard deviation for...Ch. 2.4 - Compute x,s2, and s for each of the following data...Ch. 2.4 - Calculate the range, variance, and standard...Ch. 2.4 - Using only integers between 0 and 10, construct...Ch. 2.4 - Using only integers between 0 and 10, construct...Ch. 2.4 - Consider the following sample of five...Ch. 2.4 - Use the applet entitled Standard Deviation to find...Ch. 2.4 - Use the applet Standard Deviation to study the...Ch. 2.4 - Use the applet Standard Deviation to study the...Ch. 2.4 - Hotels use of ecolabels. Refer to the Journal of...Ch. 2.4 - Permeability of sandstone during weathering. Refer...Ch. 2.4 - Performance of stock screeners. Refer to the...Ch. 2.4 - Corporate sustainability of CPA firms. Refer to...Ch. 2.4 - Is honey a cough remedy? Refer to the Archives of...Ch. 2.4 - Active nuclear power plants. Refer to Exercise...Ch. 2.4 - Estimating production time. A widely used...Ch. 2.5 - The output from a statistical software package...Ch. 2.5 - Prob. 2.72LMCh. 2.5 - For a set of data with a mound-shaped relative...Ch. 2.5 - The following is a sample of 25 measurements: a....Ch. 2.5 - Given a data set with a largest value of 760 and a...Ch. 2.5 - Voltage sags and swells. The power quality of a...Ch. 2.5 - Permeability of sandstone during weathering. Refer...Ch. 2.5 - Do social robots walk or roll? Refer to the...Ch. 2.5 - College dropout study. The American Economic...Ch. 2.5 - Motivation of drug dealers. Consider a study of...Ch. 2.5 - Sanitation inspection of cruise ships. Refer to...Ch. 2.5 - Volkswagen emissions scandal. Refer to the...Ch. 2.5 - Auditing water resources in Australia. Australia...Ch. 2.5 - The Apprentice contestants performance ratings....Ch. 2.5 - Shopping vehicle and judgment. While shopping at...Ch. 2.5 - Buy-side vs. sell-side analysts earnings...Ch. 2.5 - Prob. 2.87ACACh. 2.5 - Improving SAT scores. The National Education...Ch. 2.5 - Prob. 2.89ACACh. 2.6 - Compute the z-score corresponding to each of the...Ch. 2.6 - Give the percentage of measurements in a data set...Ch. 2.6 - In terms of percentiles, define QL, QM and QU.Ch. 2.6 - Compare the z-scores to decide which of the...Ch. 2.6 - Suppose that 40 and 90 are two elements of a...Ch. 2.6 - Mathematics assessment test scores. According to...Ch. 2.6 - Prob. 2.96ACBCh. 2.6 - Prob. 2.97ACBCh. 2.6 - Sanitation inspection of cruise ships Refer to the...Ch. 2.6 - Prob. 2.99ACICh. 2.6 - Prob. 2.100ACICh. 2.6 - Executive networking and firm performance. Do...Ch. 2.6 - Blue- vs. red-colored exam study. In a study of...Ch. 2.6 - Ranking PhD programs in economics. Thousands of...Ch. 2.6 - Using z-scores for grades. At one university, the...Ch. 2.6 - Prob. 2.105ACACh. 2.7 - A sample data set has a mean of 57 and a standard...Ch. 2.7 - Suppose a data set consisting of exam scores has a...Ch. 2.7 - Consider the horizontal box plot shown below. a....Ch. 2.7 - Prob. 2.109LMCh. 2.7 - Prob. 2.7AECh. 2.7 - Rankings of research universities. Refer to the...Ch. 2.7 - Voltage sags and swells. Refer to the Electrical...Ch. 2.7 - Treating psoriasis with the Doctorfish of Kangal....Ch. 2.7 - Budget lapsing at army hospitals. Accountants use...Ch. 2.7 - Salary offers to MBAs. Consider the top salary...Ch. 2.7 - Prob. 2.115ACICh. 2.7 - Prob. 2.116ACICh. 2.7 - Sanitation inspection of cruise ships. Referto...Ch. 2.7 - Network server downtime. A manufacturer of network...Ch. 2.7 - Permeability of sandstone during weathering. Refer...Ch. 2.7 - Prob. 2.120ACACh. 2.7 - Prob. 2.121ACACh. 2.8 - Construct a scatterplot for the data in the...Ch. 2.8 - Construct a scatterplot for the data in the...Ch. 2.8 - Prob. 2.124ACBCh. 2.8 - Prob. 2.125ACBCh. 2.8 - Lobster trap placement. Strategic placement of...Ch. 2.8 - Does elevation impact hitting performance in...Ch. 2.8 - Prob. 2.128ACBCh. 2.8 - Prob. 2.129ACBCh. 2.8 - Spreading rate of spilled liquid A contract...Ch. 2.8 - Performance ratings of government agencies. The...Ch. 2.8 - Most valuable NFL teams. Refer to the Forbes...Ch. 2.8 - Best-paid CEOs. Refer to Glassdoor Economic...Ch. 2.8 - Prob. 2.134ACACh. 2.10 - Museum management. Refer to the Museum Management...Ch. 2.10 - Volkswagen emissions scandal. Refer to the...Ch. 2.10 - BP oil leak. In the summer of 2010, an explosion...Ch. 2 - Construet a relative frequency histogram for the...Ch. 2 - Discuss the conditions under which the median is...Ch. 2 - Consider the following three measurements: 50, 70,...Ch. 2 - Refer to Exercise 2.141c. For parts a-d, determine...Ch. 2 - For each of the following data sets, compute x,...Ch. 2 - For each of the following data sets, compute x,...Ch. 2 - Explain why we generally prefer the standard...Ch. 2 - If the range of a set of data is 20, find a rough...Ch. 2 - Prob. 2.147LMCh. 2 - Motivation of drug dealers. Refer to the Applied...Ch. 2 - Slogs for Fortune 500 firms. Web site...Ch. 2 - Management system failures. The U.S. Chemical...Ch. 2 - Business marketing publications....Ch. 2 - U.S. business bankruptcies. The American...Ch. 2 - Prob. 2.153ACBCh. 2 - Products Made in the USA. Made in the USA is a...Ch. 2 - Prob. 2.155ACBCh. 2 - Drivers stopped by police. According to the Bureau...Ch. 2 - U.S. wine export markets. The Center for...Ch. 2 - Prob. 2.158ACICh. 2 - Hull failures of oil tankers. Owing to several...Ch. 2 - Software defects. The Promise Software Engineering...Ch. 2 - Prob. 2.161ACICh. 2 - Time to develop price quotes. A manufacturer of...Ch. 2 - Trend in Iraq War casualties. While the United...Ch. 2 - Prob. 2.164ACICh. 2 - Radiation levels in homes. In some locations,...Ch. 2 - Doctors and ethics. For physicians confronted with...Ch. 2 - Prob. 2.167ACICh. 2 - Investigating the claims of weight-loss clinics....Ch. 2 - Age discrimination study. The Age Discrimination...Ch. 2 - No Child Left Behind Act. According to the...Ch. 2 - Steel rod quality. In his essay Making Things...
Additional Math Textbook Solutions
Find more solutions based on key concepts
A father rates his daughter as a 2 on a 7-point scale (from 1 to 7) of crankiness. In this example, (a) what is...
Statistics for Psychology
A Pew Research Center survey found a noticeable rise in smartphone ownership and internet usage in emerging and...
Business Statistics: A First Course (8th Edition)
TRY IT YOURSELF 2
Determine whether each number describes a population parameter or a sample statistic. Explain...
Elementary Statistics: Picturing the World (7th Edition)
Teacher Salaries
The following data from several years ago represent salaries (in dollars) from a school distri...
Elementary Statistics: A Step By Step Approach
Empirical versus Theoretical A Monopoly player claims that the probability of getting a 4 when rolling a six-si...
Introductory Statistics (2nd Edition)
Knowledge Booster


Learn more about
Need a deep-dive on the concept behind this application? Look no further. Learn more about this topic, statistics and related others by exploring similar questions and additional content below.Similar questions
- A statistical program is recommended. Jensen Tire & Auto is in the process of deciding whether to purchase a maintenance contract for its new computer wheel alignment and balancing machine. Managers feel that maintenance expense should be related to usage, and they collected the following information on weekly usage (hours) and annual maintenance expense (in hundreds of dollars). Weekly Usage(hours) AnnualMaintenanceExpense 13 17.0 10 22.0 20 30.0 28 37.0 32 47.0 17 30.5 24 32.5 31 39.0 40 51.5 38 40.0 #1) Develop the estimated regression equation that could be used to predict the annual maintenance expense (in hundreds of dollars) given the weekly usage (in hours). (Round your numerical values to two decimal places.) #2) The expected expense of a machine being used 34 hours per week is $ hundred.arrow_forwardIn the digital age of marketing, special care must be taken to ensure that programmatic ads appear on websites aligned with a company’s strategy, culture, and ethics. For example, in , Nordstrom, Amazon, and Whole Foods each faced boycotts from social media users when automated ads for these companies showed up on the Breitbart website (ChiefMarketer.com website). It is important for marketing professionals to understand a company's values and culture. The following data are from an experiment designed to investigate the perception of corporate ethical values among individuals specializing in marketing (higher scores indicate higher ethical values). Marketing Managers Marketing Research Advertising 6 5 5 5 5 6 4 4 5 5 4 4 6 5 5 4 4 5 a. Use to test for a significant difference in perception among the three groups. Compute the values identified below (to decimals, if necessary). Sum of Squares, Treatment Sum of Squares, Error Mean Squares, Treatment…arrow_forwardIn the digital age of marketing, special care must be taken to ensure that programmatic ads appear on websites aligned with a company’s strategy, culture, and ethics. For example, in , Nordstrom, Amazon, and Whole Foods each faced boycotts from social media users when automated ads for these companies showed up on the Breitbart website (ChiefMarketer.com website). It is important for marketing professionals to understand a company's values and culture. The following data are from an experiment designed to investigate the perception of corporate ethical values among individuals specializing in marketing (higher scores indicate higher ethical values). Marketing Managers Marketing Research Advertising 9 8 8 8 8 9 7 7 8 8 7 7 9 8 8 7 7 8 Use a = 0.05 to test for a significant difference in perception among the three groups. Compute the values identified below (to 2 decimals, if necessary). Sum of Squares, Treatment Sum of Squares, Error Mean Squares,…arrow_forward
- Reviewers from the Oregon Evidence-Based Practice Center at the Oregon Health and Science University investigated the effectiveness of prescription drugs in assisting people to fall asleep and stay asleep (source: S. Carson, M.S. McDonagh, et al., “Drug class review: Newer drugs for insomnia,” Oregon Health and Science University, 2008, http://www.ncbi.nlm.nih.gov). Suppose a study of two drugs, Sonata and Ambien, was conducted and the resulting data are contained in a file titled Shuteye. The samples reflect an experiment in which individuals were randomly given the two brands of pills on separate evenings. Their time spent sleeping was recorded for each of the brands of sleeping pills. (A) Does the experiment seem to have dependent or independent samples? Explain your reasoning. (B) Do the data indicate that there is a statistical difference in the mean time spent sleeping for people using the two drugs? Test using alpha = 0.02. Conduct a statistical procedure to determine this. (C)…arrow_forwardA researcher is interested in examining the relationship between ACT scores and college GPA. What can youconclude from the following data? Based on the interpretation framework discussed in class, how strong is thiscorrelation? Discuss the relative movement of the variables Participant ACT GPA1 24 2.752 28 3.253 29 3.504 35 3.755 34 4.006 30 3.807 29 2.608 27 2.689 31 3.36arrow_forwardIn the COVID-19 data set, there are several questions that participants answer about the reactions of their government to the pandemic, as well as questions about their own well-being, in terms of measures of distress, such as anxiety and depression. This data was collected quite early in the pandemic, near the beginning of the first wave in late March. One might ask whether how one viewed their government might affect one's concerns about the health of their family and themselves. What type of procedure might you use to see whether there was an association between attitudes towards governtment and worries about health? Group of answer choices Correlation Related Samples t Test Chi-Square Goodness of Fit Test Oneway ANOVAarrow_forward
- An owner of an ice cream shop wants to investigate whether a new training program affects the scooping skills of ice cream shop employees. To assess this, the owner divides employees into two groups: those who receive training (CT) and those who do not (NT). The owner evaluates their scooping skills using a scooping proficiency test. The dataset includes the test scores of the NT (no training) group: 15.00, 7.00, 18.00, 10.00, 6.00, and 20.00, and the CT (trained) group: 15.00, 10.00, 14.00, 7.00, 21.00, and 21.00. The owner is aware of the known population mean for scooping proficiency, which is 20. The hypothesis is that employees who did not receive training (NT) will likely have lower scooping proficiency than the population mean. To investigate this hypothesis, the owner conducts a one-sample t-test with a significance level (alpha) set at 0.05. The objective is to determine if the mean scooping proficiency of the NT group is significantly different from the established population…arrow_forwardAn owner of an ice cream shop wants to investigate whether a new training program affects the scooping skills of ice cream shop employees. To assess this, the owner divides employees into two groups: those who receive training (CT) and those who do not (NT). The owner evaluates their scooping skills using a scooping proficiency test. The dataset includes the test scores of the NT (no training) group: 15.00, 7.00, 18.00, 10.00, 6.00, and 20.00, and the CT (trained) group: 15.00, 10.00, 14.00, 7.00, 21.00, and 21.00. The owner is aware of the known population mean for scooping proficiency, which is 20. The hypothesis is that employees who did not receive training (NT) will likely have lower scooping proficiency than the population mean. To investigate this hypothesis, the owner conducts a one-sample t-test with a significance level (alpha) set at 0.05. The objective is to determine if the mean scooping proficiency of the NT group is significantly different from the established population…arrow_forwardAn owner of an ice cream shop wants to investigate whether a new training program affects the scooping skills of ice cream shop employees. To assess this, the owner divides employees into two groups: those who receive training (CT) and those who do not (NT). The owner evaluates their scooping skills using a scooping proficiency test. The dataset includes the test scores of the NT (no training) group: 15.00, 7.00, 18.00, 10.00, 6.00, and 20.00, and the CT (trained) group: 15.00, 10.00, 14.00, 7.00, 21.00, and 21.00. The owner is aware of the known population mean for scooping proficiency, which is 20. The hypothesis is that employees who did not receive training (NT) will likely have lower scooping proficiency than the population mean. To investigate this hypothesis, the owner conducts a one-sample t-test with a significance level (alpha) set at 0.05. The objective is to determine if the mean scooping proficiency of the NT group is significantly different from the established population…arrow_forward
- An owner of an ice cream shop wants to investigate whether a new training program affects the scooping skills of ice cream shop employees. To assess this, the owner divides employees into two groups: those who receive training (CT) and those who do not (NT). The owner evaluates their scooping skills using a scooping proficiency test. The dataset includes the test scores of the NT (no training) group: 15.00, 7.00, 18.00, 10.00, 6.00, and 20.00, and the CT (trained) group: 15.00, 10.00, 14.00, 7.00, 21.00, and 21.00. The owner is aware of the known population mean for scooping proficiency, which is 20. The hypothesis is that employees who did not receive training (NT) will likely have lower scooping proficiency than the population mean. To investigate this hypothesis, the owner conducts a one-sample t-test with a significance level (alpha) set at 0.05. The objective is to determine if the mean scooping proficiency of the NT group is significantly different from the established population…arrow_forwardAn owner of an ice cream shop wants to investigate whether a new training program affects the scooping skills of ice cream shop employees. To assess this, the owner divides employees into two groups: those who receive training (CT) and those who do not (NT). The owner evaluates their scooping skills using a scooping proficiency test. The dataset includes the test scores of the NT (no training) group: 15.00, 7.00, 18.00, 10.00, 6.00, and 20.00, and the CT (trained) group: 15.00, 10.00, 14.00, 7.00, 21.00, and 21.00. The owner is aware of the known population mean for scooping proficiency, which is 20. The hypothesis is that employees who did not receive training (NT) will likely have lower scooping proficiency than the population mean. To investigate this hypothesis, the owner conducts a one-sample t-test with a significance level (alpha) set at 0.05. The objective is to determine if the mean scooping proficiency of the NT group is significantly different from the established population…arrow_forwardAn owner of an ice cream shop wants to investigate whether a new training program affects the scooping skills of ice cream shop employees. To assess this, the owner divides employees into two groups: those who receive training (CT) and those who do not (NT). The owner evaluates their scooping skills using a scooping proficiency test. The dataset includes the test scores of the NT (no training) group: 15.00, 7.00, 18.00, 10.00, 6.00, and 20.00, and the CT (trained) group: 15.00, 10.00, 14.00, 7.00, 21.00, and 21.00. The owner is aware of the known population mean for scooping proficiency, which is 20. The hypothesis is that employees who did not receive training (NT) will likely have lower scooping proficiency than the population mean. To investigate this hypothesis, the owner conducts a one-sample t-test with a significance level (alpha) set at 0.05. The objective is to determine if the mean scooping proficiency of the NT group is significantly different from the established population…arrow_forward
arrow_back_ios
SEE MORE QUESTIONS
arrow_forward_ios
Recommended textbooks for you
 Glencoe Algebra 1, Student Edition, 9780079039897...AlgebraISBN:9780079039897Author:CarterPublisher:McGraw Hill
Glencoe Algebra 1, Student Edition, 9780079039897...
Algebra
ISBN:9780079039897
Author:Carter
Publisher:McGraw Hill
Hypothesis Testing using Confidence Interval Approach; Author: BUM2413 Applied Statistics UMP;https://www.youtube.com/watch?v=Hq1l3e9pLyY;License: Standard YouTube License, CC-BY
Hypothesis Testing - Difference of Two Means - Student's -Distribution & Normal Distribution; Author: The Organic Chemistry Tutor;https://www.youtube.com/watch?v=UcZwyzwWU7o;License: Standard Youtube License