
Statistics for Business and Economics (13th Edition)
13th Edition
ISBN: 9780134506593
Author: James T. McClave, P. George Benson, Terry Sincich
Publisher: PEARSON
expand_more
expand_more
format_list_bulleted
Concept explainers
Videos
Textbook Question
Chapter 2.5, Problem 2.74LM
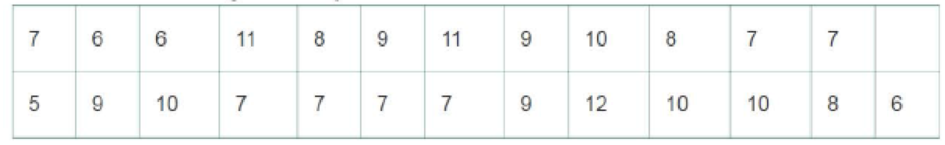
The following is a sample of 25 measurements:
- a. Compute
s2
, and s for this sample.
- b. Count the number of measurements in the intervals
- c. Compare the percentages found in part b to the percentages given by the
Empirical Rule and Chebyshev’s Rule. - d. Calculate the
range and use it to obtain a rough approximation for s. Does the result compare favorably with the actual value for s found in part a?
Expert Solution & Answer
Want to see the full answer?
Check out a sample textbook solution
Students have asked these similar questions
given normally distributed sample x=12 and s=3, use the Empirical Rule determine the upper and lower bounds to contain approximately 95% of your data
Given that n=82 data points are collected when studying the relationship between average daily temperature and time spent watching television, use the critical values table below to determine if a calculated value of r=−0.974 is significant or not.
df
CV (+ and -)
df
CV (+ and -)
df
CV (+ and -)
df
CV (+ and -)
1
0.997
11
0.555
21
0.413
40
0.304
2
0.950
12
0.532
22
0.404
50
0.273
3
0.878
13
0.514
23
0.396
60
0.250
4
0.811
14
0.497
24
0.388
70
0.232
5
0.754
15
0.482
25
0.381
80
0.217
6
0.707
16
0.468
26
0.374
90
0.205
7
0.666
17
0.456
27
0.367
100
0.195
8
0.632
18
0.444
28
0.361
9
0.602
19
0.433
29
0.355
10
0.576
20
0.423
30
0.349
Select the correct answer below:
r is significant because it is between the positive and negative critical values.
r is not significant because it is between the positive and negative critical values.
r is significant because it is not between the positive and negative critical values.
r is not…
Consider the following set of five independent measurements of some unknown random quantity: -1.5, 0.3, -1.2, -0.2, 0.5.
Based on these measurements, we can estimate E(X)=? (accurate to at least four decimal places).
Based on these measurements, we can estimate Var(X)=? (accurate to at least four decimal places).
Chapter 2 Solutions
Statistics for Business and Economics (13th Edition)
Ch. 2.1 - Complete the following table.Ch. 2.1 - A qualitative variable with three classes (X, Y,...Ch. 2.1 - STEM experiences for girls. The National Science...Ch. 2.1 - Cable TV subscriptions and cord cutters. Has the...Ch. 2.1 - Do social robots walk or roll? A social (or...Ch. 2.1 - Top credit card issuers, by region. The Nilson...Ch. 2.1 - Microsoft program security issues. To help its...Ch. 2.1 - Jamming attacks on wireless networks. Refer to the...Ch. 2.1 - The Apprentice contestants performance ratings....Ch. 2.1 - The economic return to earning an MBA. Refer to...
Ch. 2.1 - Profiling UK rental malls. An analysis of the...Ch. 2.1 - History of corporate acquisitions. A corporate...Ch. 2.1 - Twitter opinions of iPhone 6 features. What are...Ch. 2.1 - Museum management. What criteria do museums use to...Ch. 2.1 - Advertising with reader-response cards....Ch. 2.1 - Motivation and right-oriented bias. Evolutionary...Ch. 2.1 - Groundwater contamination in wells. In New...Ch. 2.2 - Graph the relative frequency histogram for the 500...Ch. 2.2 - Refer to Exercise 2.18. Calculate the number of...Ch. 2.2 - Consider the stem-and-leaf display shown here. a....Ch. 2.2 - Minitab was used to generate the following...Ch. 2.2 - Stability of compounds in new drugs. Testing the...Ch. 2.2 - Corporate sustainability of CPA firms. Refer to...Ch. 2.2 - Sanitation inspection of cruise ships. To minimize...Ch. 2.2 - History of corporate acquisitions. Refer to the...Ch. 2.2 - Most valuable NFL teams. Each year Forbes reports...Ch. 2.2 - State SAT scores. Educators are constantly...Ch. 2.2 - Items arriving and departing a work center. In a...Ch. 2.2 - Crude oil biodegradation. In order to protect...Ch. 2.2 - Volkswagen emissions scandal. Recently, the...Ch. 2.2 - Is honey a cough remedy? Does a teaspoon of honey...Ch. 2.2 - Time in bankruptcy. Financially distressed firms...Ch. 2.2 - Prob. 2.33ACACh. 2.2 - Prob. 2.34ACACh. 2.3 - Calculate the mean and median of the following...Ch. 2.3 - Calculate the mean for samples where a. n = 10, x...Ch. 2.3 - Explain how the relationship between the mean and...Ch. 2.3 - Explain the difference between the calculation of...Ch. 2.3 - Calculate the mode, mean, and median of the...Ch. 2.3 - Calculate the mean, median, and mode for each of...Ch. 2.3 - Describe how the mean compares to the median for a...Ch. 2.3 - Use the applet entitled Mean versus Median to find...Ch. 2.3 - Prob. 2.2AECh. 2.3 - Use the applet Mean versus Median to study the...Ch. 2.3 - Hotels use of ecolabels. Ecolabels such as Energy...Ch. 2.3 - Rankings of research universities. Based on...Ch. 2.3 - Performance of stock screeners. Investment...Ch. 2.3 - Performance-based logistics. Refer to the Journal...Ch. 2.3 - Surface roughness of oil field pipe. Oil field...Ch. 2.3 - Prob. 2.47ACICh. 2.3 - Corporate sustainability of CPA firms. Refer to...Ch. 2.3 - Is honey a cough remedy? Refer to the Archives of...Ch. 2.3 - Crude oil biodegradation. Refer to the Journal of...Ch. 2.3 - Symmetric or skewed? Would you expect the data...Ch. 2.3 - Prob. 2.52ACICh. 2.3 - Prob. 2.53ACACh. 2.3 - Prob. 2.54ACACh. 2.3 - Prob. 2.55ACACh. 2.4 - Answer the following questions about variability...Ch. 2.4 - Calculate the range, variance, and standard...Ch. 2.4 - Calculate the variance and standard deviation for...Ch. 2.4 - Compute x,s2, and s for each of the following data...Ch. 2.4 - Calculate the range, variance, and standard...Ch. 2.4 - Using only integers between 0 and 10, construct...Ch. 2.4 - Using only integers between 0 and 10, construct...Ch. 2.4 - Consider the following sample of five...Ch. 2.4 - Use the applet entitled Standard Deviation to find...Ch. 2.4 - Use the applet Standard Deviation to study the...Ch. 2.4 - Use the applet Standard Deviation to study the...Ch. 2.4 - Hotels use of ecolabels. Refer to the Journal of...Ch. 2.4 - Permeability of sandstone during weathering. Refer...Ch. 2.4 - Performance of stock screeners. Refer to the...Ch. 2.4 - Corporate sustainability of CPA firms. Refer to...Ch. 2.4 - Is honey a cough remedy? Refer to the Archives of...Ch. 2.4 - Active nuclear power plants. Refer to Exercise...Ch. 2.4 - Estimating production time. A widely used...Ch. 2.5 - The output from a statistical software package...Ch. 2.5 - Prob. 2.72LMCh. 2.5 - For a set of data with a mound-shaped relative...Ch. 2.5 - The following is a sample of 25 measurements: a....Ch. 2.5 - Given a data set with a largest value of 760 and a...Ch. 2.5 - Voltage sags and swells. The power quality of a...Ch. 2.5 - Permeability of sandstone during weathering. Refer...Ch. 2.5 - Do social robots walk or roll? Refer to the...Ch. 2.5 - College dropout study. The American Economic...Ch. 2.5 - Motivation of drug dealers. Consider a study of...Ch. 2.5 - Sanitation inspection of cruise ships. Refer to...Ch. 2.5 - Volkswagen emissions scandal. Refer to the...Ch. 2.5 - Auditing water resources in Australia. Australia...Ch. 2.5 - The Apprentice contestants performance ratings....Ch. 2.5 - Shopping vehicle and judgment. While shopping at...Ch. 2.5 - Buy-side vs. sell-side analysts earnings...Ch. 2.5 - Prob. 2.87ACACh. 2.5 - Improving SAT scores. The National Education...Ch. 2.5 - Prob. 2.89ACACh. 2.6 - Compute the z-score corresponding to each of the...Ch. 2.6 - Give the percentage of measurements in a data set...Ch. 2.6 - In terms of percentiles, define QL, QM and QU.Ch. 2.6 - Compare the z-scores to decide which of the...Ch. 2.6 - Suppose that 40 and 90 are two elements of a...Ch. 2.6 - Mathematics assessment test scores. According to...Ch. 2.6 - Prob. 2.96ACBCh. 2.6 - Prob. 2.97ACBCh. 2.6 - Sanitation inspection of cruise ships Refer to the...Ch. 2.6 - Prob. 2.99ACICh. 2.6 - Prob. 2.100ACICh. 2.6 - Executive networking and firm performance. Do...Ch. 2.6 - Blue- vs. red-colored exam study. In a study of...Ch. 2.6 - Ranking PhD programs in economics. Thousands of...Ch. 2.6 - Using z-scores for grades. At one university, the...Ch. 2.6 - Prob. 2.105ACACh. 2.7 - A sample data set has a mean of 57 and a standard...Ch. 2.7 - Suppose a data set consisting of exam scores has a...Ch. 2.7 - Consider the horizontal box plot shown below. a....Ch. 2.7 - Prob. 2.109LMCh. 2.7 - Prob. 2.7AECh. 2.7 - Rankings of research universities. Refer to the...Ch. 2.7 - Voltage sags and swells. Refer to the Electrical...Ch. 2.7 - Treating psoriasis with the Doctorfish of Kangal....Ch. 2.7 - Budget lapsing at army hospitals. Accountants use...Ch. 2.7 - Salary offers to MBAs. Consider the top salary...Ch. 2.7 - Prob. 2.115ACICh. 2.7 - Prob. 2.116ACICh. 2.7 - Sanitation inspection of cruise ships. Referto...Ch. 2.7 - Network server downtime. A manufacturer of network...Ch. 2.7 - Permeability of sandstone during weathering. Refer...Ch. 2.7 - Prob. 2.120ACACh. 2.7 - Prob. 2.121ACACh. 2.8 - Construct a scatterplot for the data in the...Ch. 2.8 - Construct a scatterplot for the data in the...Ch. 2.8 - Prob. 2.124ACBCh. 2.8 - Prob. 2.125ACBCh. 2.8 - Lobster trap placement. Strategic placement of...Ch. 2.8 - Does elevation impact hitting performance in...Ch. 2.8 - Prob. 2.128ACBCh. 2.8 - Prob. 2.129ACBCh. 2.8 - Spreading rate of spilled liquid A contract...Ch. 2.8 - Performance ratings of government agencies. The...Ch. 2.8 - Most valuable NFL teams. Refer to the Forbes...Ch. 2.8 - Best-paid CEOs. Refer to Glassdoor Economic...Ch. 2.8 - Prob. 2.134ACACh. 2.10 - Museum management. Refer to the Museum Management...Ch. 2.10 - Volkswagen emissions scandal. Refer to the...Ch. 2.10 - BP oil leak. In the summer of 2010, an explosion...Ch. 2 - Construet a relative frequency histogram for the...Ch. 2 - Discuss the conditions under which the median is...Ch. 2 - Consider the following three measurements: 50, 70,...Ch. 2 - Refer to Exercise 2.141c. For parts a-d, determine...Ch. 2 - For each of the following data sets, compute x,...Ch. 2 - For each of the following data sets, compute x,...Ch. 2 - Explain why we generally prefer the standard...Ch. 2 - If the range of a set of data is 20, find a rough...Ch. 2 - Prob. 2.147LMCh. 2 - Motivation of drug dealers. Refer to the Applied...Ch. 2 - Slogs for Fortune 500 firms. Web site...Ch. 2 - Management system failures. The U.S. Chemical...Ch. 2 - Business marketing publications....Ch. 2 - U.S. business bankruptcies. The American...Ch. 2 - Prob. 2.153ACBCh. 2 - Products Made in the USA. Made in the USA is a...Ch. 2 - Prob. 2.155ACBCh. 2 - Drivers stopped by police. According to the Bureau...Ch. 2 - U.S. wine export markets. The Center for...Ch. 2 - Prob. 2.158ACICh. 2 - Hull failures of oil tankers. Owing to several...Ch. 2 - Software defects. The Promise Software Engineering...Ch. 2 - Prob. 2.161ACICh. 2 - Time to develop price quotes. A manufacturer of...Ch. 2 - Trend in Iraq War casualties. While the United...Ch. 2 - Prob. 2.164ACICh. 2 - Radiation levels in homes. In some locations,...Ch. 2 - Doctors and ethics. For physicians confronted with...Ch. 2 - Prob. 2.167ACICh. 2 - Investigating the claims of weight-loss clinics....Ch. 2 - Age discrimination study. The Age Discrimination...Ch. 2 - No Child Left Behind Act. According to the...Ch. 2 - Steel rod quality. In his essay Making Things...
Additional Math Textbook Solutions
Find more solutions based on key concepts
Testing Hypotheses. In Exercises 13-24, assume that a simple random sample has been selected and test the given...
Elementary Statistics Using The Ti-83/84 Plus Calculator, Books A La Carte Edition (5th Edition)
(a) For each data set, find the mean, median, and mode. (b) Discuss anything about the data that affects the us...
APPLIED STAT.IN BUS.+ECONOMICS
Four different beverages are sold at a fast-food restaurant: soft drinks, tea, coffee, and bottled water. a. Ex...
Basic Business Statistics, Student Value Edition
The data in Table 1A were collected from one of the authors’ statistics classes. The first row gives the variab...
Introductory Statistics
In a test of the quality of two television commercials, each commercial was shown in a separate test area six t...
Statistics for Business & Economics, Revised (MindTap Course List)
Knowledge Booster


Learn more about
Need a deep-dive on the concept behind this application? Look no further. Learn more about this topic, statistics and related others by exploring similar questions and additional content below.Similar questions
- As noted on page 275, when the two population means are equal, the estimated standard error for the indepen- dent-measures t test provides a measure of how much difference to expect between two sample means. For each of the following situations, assume that m1 5 m2 and calculate how much difference should be expected between the two sample means. One sample has n 5 6 scores with SS 5 70 and the second sample has n 5 10 scores with SS 5 140. One sample has n 5 6 scores with SS 5 310 and the second sample has n 5 10 scores with SS 5 530. In Part b, the samples have larger variability (big- ger SS values) than in Part a, but the sample sizes are unchanged. How does larger variability affect the magnitude of the standard error for the sample mean difference?arrow_forwardA vending machine company wants to check three of its machines to determine if they are properly dispensing 12 ounces of coffee. Test by using α=0.05. Their data is given below. Machine A Machine B Machine C 11.8 11.7 12.2 12.1 11.9 12.1 12.0 11.7 12.0 11.9 11.8 11.9 12.1 12.0 12.2 Group of answer choices There is sufficient evidence to reject the claim that the proportions are equal because the p-value 0.0255 < 0.05 There is insufficient evidence to conclude the claim that the proportions are equal because the p-value 0.0255 < 0.05 There is insufficient evidence to reject the claim that the proportions are equal because the p-value 0.0255 < 0.05 There is sufficient evidence to conclude the claim that the proportions are equal because the p-value 0.0255 < 0.05arrow_forwardTo find out whether the inhabitants of two SouthPacific islands may be regarded as having the same racial ancestry, an anthropologist determines the cephalicindices of six adult males from each island, getting x1 = 77.4 and x2 = 72.2 and the corresponding stan-dard deviations s1 = 3.3 and s2 = 2.1. Use the four steps in the initial part of Section 1 and the 0.01 level of sig-nificance to see whether the difference between the two sample means can reasonably be attributed to chance.Assume that the populations sampled are normal andhave equal variances.arrow_forward
- For each of the following studies: (a) identify the sample size(s), (b) state if we have a significant difference based on the calculated t-value given at alpha = .05 and alpha = .01. In the two-sample case, assume equal sample sizes, and (c) calculate r2 if significant. One-sample t test: t(30) = 2.050 Two sample independent measures t-test: t(18) = 1.50 One-sample t-test: t(35) = 1.75arrow_forwardFor a population with u=50 and o=10,what is the x value corresponding to z=0.4?arrow_forwardA researcher obtains M = 45 with SS = 250 for a sample of n = 10 women and M = 49 with SS = 270 for a sample of n = 10 men. If the two samples are used to evaluate the mean difference between the two populations, what value will be obtained for the t statistic?arrow_forward
- Two samples of sizes 60 and 90 have 52 and 48 as the respective A.Ms. and 9 and 12 as the respective S.Ds. Find the A.M and S.D. of the combined sample of size 150.arrow_forwardPenicillin is produced by the Penicillin fungus, which is grown in a broth whose sugar content must be carefully controlled. Several samples of broth were taken on three successive days, and the amount of dissolved sugars, in milligrams per milliliter, was measured on each sample. The results were as follows. Day 1 : 4.9 5.4 5.3 4.9 5.2 5.1 5.4 4.9 5.1 5.1 4.9 5.4 Day 2 : 5.5 5.2 5.1 5.0 5.3 5.4 5.3 5.2 5.4 5.3 5.4 5.1 Day 3 : 5.8 5.0 5.4 5.5 5.5 5.5 4.8 5.5 5.2 4.9 5.5 5.0 Construct an ANOVA table. Round your answers to four decimal places as needed. One-way ANOVA: Sugar Concentration Source DF SS MS F P Days Error Total Is there enough evidence to conclude that the mean sugar concentration…arrow_forwardA treatment is administered to a sample selected from a population with a mean of u = 34 and a standard deviation of o = 8. After treatment, the effect size is measured by computing Cohen’s d, and a value of d = 0.00 is obtained. Based on this information, what is the mean for the treated sample?arrow_forward
- A sample of 12 radon detectors of a certain type was selected, and each was exposed to 100 pCi/L of radon. The resulting readings were as follows: 105.6 90.9 91.2 96.9 96.5 91.3 100.1 105.5 99.6 107.7 103.3 92.4 Does this data suggest that the population mean reading under these conditions differ from 100? (a) State the null and alternative hypotheses. (b) Calculate, correct to 2 decimal places, (i) the sample mean, x ; and (ii) the sample standard deviation, s. (c) Evaluate the appropriate test statistic. (d) Test these hypotheses at 0.05 level of significance.arrow_forwardWhat is the Discrete Variable Standard Deviation for the following numbers:x = 0 and P(X = x) = 0.51x = 1 and P(X = x) = 0.11x = 2 and P(X = x) = 0.09x = 3 and P(X = x) = 0.16x = 4 and P(X = x) = 0.13arrow_forward
arrow_back_ios
arrow_forward_ios
Recommended textbooks for you
 MATLAB: An Introduction with ApplicationsStatisticsISBN:9781119256830Author:Amos GilatPublisher:John Wiley & Sons Inc
 Probability and Statistics for Engineering and th...StatisticsISBN:9781305251809Author:Jay L. DevorePublisher:Cengage Learning
 Statistics for The Behavioral Sciences (MindTap C...StatisticsISBN:9781305504912Author:Frederick J Gravetter, Larry B. WallnauPublisher:Cengage Learning
 Elementary Statistics: Picturing the World (7th E...StatisticsISBN:9780134683416Author:Ron Larson, Betsy FarberPublisher:PEARSON
 The Basic Practice of StatisticsStatisticsISBN:9781319042578Author:David S. Moore, William I. Notz, Michael A. FlignerPublisher:W. H. Freeman
 Introduction to the Practice of StatisticsStatisticsISBN:9781319013387Author:David S. Moore, George P. McCabe, Bruce A. CraigPublisher:W. H. Freeman
MATLAB: An Introduction with Applications
Statistics
ISBN:9781119256830
Author:Amos Gilat
Publisher:John Wiley & Sons Inc
Probability and Statistics for Engineering and th...
Statistics
ISBN:9781305251809
Author:Jay L. Devore
Publisher:Cengage Learning
Statistics for The Behavioral Sciences (MindTap C...
Statistics
ISBN:9781305504912
Author:Frederick J Gravetter, Larry B. Wallnau
Publisher:Cengage Learning
Elementary Statistics: Picturing the World (7th E...
Statistics
ISBN:9780134683416
Author:Ron Larson, Betsy Farber
Publisher:PEARSON
The Basic Practice of Statistics
Statistics
ISBN:9781319042578
Author:David S. Moore, William I. Notz, Michael A. Fligner
Publisher:W. H. Freeman
Introduction to the Practice of Statistics
Statistics
ISBN:9781319013387
Author:David S. Moore, George P. McCabe, Bruce A. Craig
Publisher:W. H. Freeman
Correlation Vs Regression: Difference Between them with definition & Comparison Chart; Author: Key Differences;https://www.youtube.com/watch?v=Ou2QGSJVd0U;License: Standard YouTube License, CC-BY
Correlation and Regression: Concepts with Illustrative examples; Author: LEARN & APPLY : Lean and Six Sigma;https://www.youtube.com/watch?v=xTpHD5WLuoA;License: Standard YouTube License, CC-BY