
Videos
Members of the board of directors of Security Team have received the following operating income data for the year ended March 31, 2018:
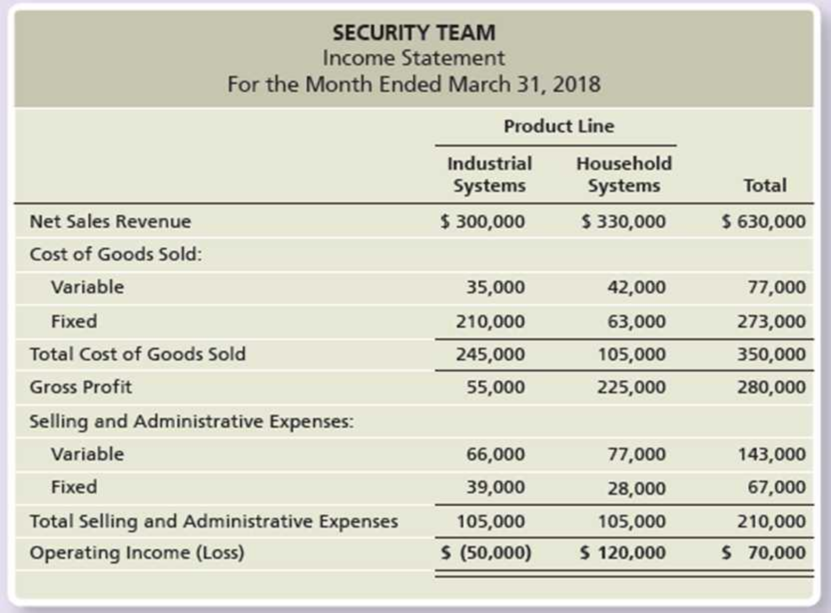
Members of the board are surprised that the industrial systems product line is losing money. They commission a study to determine whether the company should drop the line. Company accountants estimate that dropping industrial systems will decrease fixed cost of goods sold by $81,000 and decrease fixed selling and administrative expenses by $15,000.
Requirements
- 1. Prepare a differential analysis to show whether Security Team should drop the industrial systems product line.
- 2. Prepare contribution margin income statements to show Security Team’s total operating income under the two alternatives: (a) with the industrial systems line and (b) without the line. Compare the difference between the two alternatives’ income numbers to your answer to Requirement 1.
- 3. What have you learned from this comparison in Requirement 2?
Want to see the full answer?
Check out a sample textbook solution
Chapter 25 Solutions
EP FINANCIAL+MANAGERIAL ACCT. >CUSTOM<
Additional Business Textbook Solutions
Intermediate Accounting
Accounting for Governmental & Nonprofit Entities
Horngren's Cost Accounting: A Managerial Emphasis (16th Edition)
Horngren's Accounting (11th Edition)
FINANCIAL ACCT.FUND.(LOOSELEAF)
Intermediate Accounting (2nd Edition)


- Poleski Manufacturing, which maintains the same level of inventory at the end of each year, provided the following information about expenses anticipated for next year: The selling price of Poleskis single product is 16. In recent years, profits have fallen and Poleskis management is now considering a number of alternatives. Poleski wants to have a net income next year of 250,000, but expects to sell only 120,000 units unless some changes are made. The president of Poleski has asked you to calculate the companys projected net income (assuming 120,000 units are sold) and the sales needed to achieve the companys net income objective for next year. Also, compute Poleskis contribution margin per unit, contribution margin ratio, and break-even point for next year. The worksheet CVP has been provided to assist you. Note that the data from the problem have already been entered into the Data Section of the worksheet.arrow_forwardAt the beginning of the last quarter of 20x1, Youngston, Inc., a consumer products firm, hired Maria Carrillo to take over one of its divisions. The division manufactured small home appliances and was struggling to survive in a very competitive market. Maria immediately requested a projected income statement for 20x1. In response, the controller provided the following statement: After some investigation, Maria soon realized that the products being produced had a serious problem with quality. She once again requested a special study by the controllers office to supply a report on the level of quality costs. By the middle of November, Maria received the following report from the controller: Maria was surprised at the level of quality costs. They represented 30 percent of sales, which was certainly excessive. She knew that the division had to produce high-quality products to survive. The number of defective units produced needed to be reduced dramatically. Thus, Maria decided to pursue a quality-driven turnaround strategy. Revenue growth and cost reduction could both be achieved if quality could be improved. By growing revenues and decreasing costs, profitability could be increased. After meeting with the managers of production, marketing, purchasing, and human resources, Maria made the following decisions, effective immediately (end of November 20x1): a. More will be invested in employee training. Workers will be trained to detect quality problems and empowered to make improvements. Workers will be allowed a bonus of 10 percent of any cost savings produced by their suggested improvements. b. Two design engineers will be hired immediately, with expectations of hiring one or two more within a year. These engineers will be in charge of redesigning processes and products with the objective of improving quality. They will also be given the responsibility of working with selected suppliers to help improve the quality of their products and processes. Design engineers were considered a strategic necessity. c. Implement a new process: evaluation and selection of suppliers. This new process has the objective of selecting a group of suppliers that are willing and capable of providing nondefective components. d. Effective immediately, the division will begin inspecting purchased components. According to production, many of the quality problems are caused by defective components purchased from outside suppliers. Incoming inspection is viewed as a transitional activity. Once the division has developed a group of suppliers capable of delivering nondefective components, this activity will be eliminated. e. Within three years, the goal is to produce products with a defect rate less than 0.10 percent. By reducing the defect rate to this level, marketing is confident that market share will increase by at least 50 percent (as a consequence of increased customer satisfaction). Products with better quality will help establish an improved product image and reputation, allowing the division to capture new customers and increase market share. f. Accounting will be given the charge to install a quality information reporting system. Daily reports on operational quality data (e.g., percentage of defective units), weekly updates of trend graphs (posted throughout the division), and quarterly cost reports are the types of information required. g. To help direct the improvements in quality activities, kaizen costing is to be implemented. For example, for the year 20x1, a kaizen standard of 6 percent of the selling price per unit was set for rework costs, a 25 percent reduction from the current actual cost. To ensure that the quality improvements were directed and translated into concrete financial outcomes, Maria also began to implement a Balanced Scorecard for the division. By the end of 20x2, progress was being made. Sales had increased to 26,000,000, and the kaizen improvements were meeting or beating expectations. For example, rework costs had dropped to 1,500,000. At the end of 20x3, two years after the turnaround quality strategy was implemented, Maria received the following quality cost report: Maria also received an income statement for 20x3: Maria was pleased with the outcomes. Revenues had grown, and costs had been reduced by at least as much as she had projected for the two-year period. Growth next year should be even greater as she was beginning to observe a favorable effect from the higher-quality products. Also, further quality cost reductions should materialize as incoming inspections were showing much higher-quality purchased components. Required: 1. Identify the strategic objectives, classified by the Balanced Scorecard perspective. Next, suggest measures for each objective. 2. Using the results from Requirement 1, describe Marias strategy using a series of if-then statements. Next, prepare a strategy map. 3. Explain how you would evaluate the success of the quality-driven turnaround strategy. What additional information would you like to have for this evaluation? 4. Explain why Maria felt that the Balanced Scorecard would increase the likelihood that the turnaround strategy would actually produce good financial outcomes. 5. Advise Maria on how to encourage her employees to align their actions and behavior with the turnaround strategy.arrow_forwardIn 2011, Milton Thayne, president of Carbondale Electronics, received a report indicating that quality costs were 31 percent of sales. Faced with increasing pressures from imported goods, Milton resolved to take measures to improve the overall quality of the companys products. After hiring a consultant in 20x0, the company began an aggressive program of total quality control. At the end of 20x5, Milton requested an analysis of the progress the company had made in reducing and controlling quality costs. The Accounting Department assembled the following data: Required: 1. Compute the quality costs as a percentage of sales by category and in total for each year. 2. Prepare a multiple-year trend graph for quality costs, both by total costs and by category. Using the graph, assess the progress made in reducing and controlling quality costs. Does the graph provide evidence that quality has improved? Explain. 3. Using the 20x1 quality cost relationships (assume all costs are variable), calculate the quality costs that would have prevailed in 20x4. By how much did profits increase in 20x4 because of the quality improvement program? Repeat for 20x5.arrow_forward
- Moses Moonrocks Inc. has developed a balanced scorecard with a measure map that suggests that the number of erroneous shipments has a direct effect on operating profit. The company estimates that every shipment error leads to a reduction of revenue by 3,000 and increased costs of about 2,000. If the company has the following budgeted sales and costs for next month (without accounting for any possible shipping errors), determine how many shipping errors the company can afford to have and still break even:arrow_forwardConsider the following conversation between Leonard Bryner, president and manager of a firm engaged in job manufacturing, and Chuck Davis, certified management accountant, the firms controller. Leonard: Chuck, as you know, our firm has been losing market share over the past 3 years. We have been losing more and more bids, and I dont understand why. At first, I thought that other firms were undercutting simply to gain business, but after examining some of the public financial reports, I believe that they are making a reasonable rate of return. I am beginning to believe that our costs and costing methods are at fault. Chuck: I cant agree with that. We have good control over our costs. Like most firms in our industry, we use a normal job-costing system. I really dont see any significant waste in the plant. Leonard: After talking with some other managers at a recent industrial convention, Im not so sure that waste by itself is the issue. They talked about activity-based management, activity-based costing, and continuous improvement. They mentioned the use of something called activity drivers to assign overhead. They claimed that these new procedures can help to produce more efficiency in manufacturing, better control of overhead, and more accurate product costing. A big deal was made of eliminating activities that added no value. Maybe our bids are too high because these other firms have found ways to decrease their overhead costs and to increase the accuracy of their product costing. Chuck: I doubt it. For one thing, I dont see how we can increase product-costing accuracy. So many of our costs are indirect costs. Furthermore, everyone uses some measure of production activity to assign overhead costs. I imagine that what they are calling activity drivers is just some new buzzword for measures of production volume. Fads in costing come and go. I wouldnt worry about it. Ill bet that our problems with decreasing sales are temporary. You might recall that we experienced a similar problem about 12 years agoit was 2 years before it straightened out. Required: 1. Do you agree or disagree with Chuck Davis and the advice that he gave Leonard Bryner? Explain. 2. Was there anything wrong or unethical in the behavior that Chuck Davis displayed? Explain your reasoning. 3. Do you think that Chuck was well informedthat he was aware of the accounting implications of ABC and that he knew what was meant by cost drivers? Should he have been well informed? Review (in Chapter 1) the first category of the Statement of Ethical Professional Practice for management accountants. Do any of these standards apply in Chucks case?arrow_forwardKimball Company has developed the following cost formulas: Materialusage:Ym=80X;r=0.95Laborusage(direct):Yl=20X;r=0.96Overheadactivity:Yo=350,000+100X;r=0.75Sellingactivity:Ys=50,000+10X;r=0.93 where X=Directlaborhours The company has a policy of producing on demand and keeps very little, if any, finished goods inventory (thus, units produced equals units sold). Each unit uses one direct labor hour for production. The president of Kimball Company has recently implemented a policy that any special orders will be accepted if they cover the costs that the orders cause. This policy was implemented because Kimballs industry is in a recession and the company is producing well below capacity (and expects to continue doing so for the coming year). The president is willing to accept orders that minimally cover their variable costs so that the company can keep its employees and avoid layoffs. Also, any orders above variable costs will increase overall profitability of the company. Required: 1. Compute the total unit variable cost. Suppose that Kimball has an opportunity to accept an order for 20,000 units at 220 per unit. Should Kimball accept the order? (The order would not displace any of Kimballs regular orders.) 2. Explain the significance of the coefficient of correlation measures for the cost formulas. Did these measures have a bearing on your answer in Requirement 1? Should they have a bearing? Why or why not? 3. Suppose that a multiple regression equation is developed for overhead costs: Y = 100,000 + 100X1 + 5,000X2 + 300X3, where X1 = direct labor hours, X2 = number of setups, and X3 = engineering hours. The coefficient of determination for the equation is 0.94. Assume that the order of 20,000 units requires 12 setups and 600 engineering hours. Given this new information, should the company accept the special order referred to in Requirement 1? Is there any other information about cost behavior that you would like to have? Explain.arrow_forward
- Boxer Production, Inc., is in the process of considering a flexible manufacturing system that will help the company react more swiftly to customer needs. The controller, Mick Morrell, estimated that the system will have a 10-year life and a required return of 10% with a net present value of negative $500,000. Nevertheless, he acknowledges that he did not quantify the potential sales increases that might result from this improvement on the issue of on-time delivery, because it was too difficult to quantify. If there is a general agreement that qualitative factors may offer an additional net cash flow of $150,000 per year, how should Boxer proceed with this Investment?arrow_forwardBannister Company, an electronics firm, buys circuit boards and manually inserts various electronic devices into the printed circuit board. Bannister sells its products to original equipment manufacturers. Profits for the last two years have been less than expected. Mandy Confer, owner of Bannister, was convinced that her firm needed to adopt a revenue growth and cost reduction strategy to increase overall profits. After a careful review of her firms condition, Mandy realized that the main obstacle for increasing revenues and reducing costs was the high defect rate of her products (a 6 percent reject rate). She was certain that revenues would grow if the defect rate was reduced dramatically. Costs would also decline as there would be fewer rejects and less rework. By decreasing the defect rate, customer satisfaction would increase, causing, in turn, an increase in market share. Mandy also felt that the following actions were needed to help ensure the success of the revenue growth and cost reduction strategy: a. Improve the soldering capabilities by sending employees to an outside course. b. Redesign the insertion process to eliminate some of the common mistakes. c. Improve the procurement process by selecting suppliers that provide higher-quality circuit boards. Required: 1. State the revenue growth and cost reduction strategy using a series of cause-and-effect relationships expressed as if-then statements. 2. Illustrate the strategy using a strategy map. 3. Explain how the revenue growth strategy can be tested. In your explanation, discuss the role of lead and lag measures, targets, and double-loop feedback.arrow_forwardRecently, Ulrich Company received a report from an external consulting group on its quality costs. The consultants reported that the companys quality costs total about 21 percent of its sales revenues. Somewhat shocked by the magnitude of the costs, Rob Rustin, president of Ulrich Company, decided to launch a major quality improvement program. For the coming year, management decided to reduce quality costs to 17 percent of sales revenues. Although the amount of reduction was ambitious, most company officials believed that the goal could be realized. To improve the monitoring of the quality improvement program, Rob directed Pamela Golding, the controller, to prepare monthly performance reports comparing budgeted and actual quality costs. Budgeted costs and sales for the first two months of the year are as follows: The following actual sales and actual quality costs were reported for January: Required: 1. Reorganize the monthly budgets so that quality costs are grouped in one of four categories: appraisal, prevention, internal failure, or external failure. (Essentially, prepare a budgeted cost of quality report.) Also, identify each cost as variable (V) or fixed (F). (Assume that no costs are mixed.) 2. Prepare a performance report for January that compares actual costs with budgeted costs. Comment on the companys progress in improving quality and reducing its quality costs.arrow_forward
- Danna Martin, president of Mays Electronics, was concerned about the end-of-the year marketing report that she had just received. According to Larry Savage, marketing manager, a price decrease for the coming year was again needed to maintain the companys annual sales volume of integrated circuit boards (CBs). This would make a bad situation worse. The current selling price of 18 per unit was producing a 2-per-unit profithalf the customary 4-per-unit profit. Foreign competitors kept reducing their prices. To match the latest reduction would reduce the price from 18 to 14. This would put the price below the cost to produce and sell it. How could these firms sell for such a low price? Determined to find out if there were problems with the companys operations, Danna decided to hire a consultant to evaluate the way in which the CBs were produced and sold. After two weeks, the consultant had identified the following activities and costs: The consultant indicated that some preliminary activity analysis shows that per-unit costs can be reduced by at least 7. Since the marketing manager had indicated that the market share (sales volume) for the boards could be increased by 50% if the price could be reduced to 12, Danna became quite excited. Required: 1. CONCEPTUAL CONNECTION What is activity-based management? What phases of activity analysis did the consultant provide? What else remains to be done? 2. CONCEPTUAL CONNECTION Identify as many nonvalue-added costs as possible. Compute the cost savings per unit that would be realized if these costs were eliminated. Was the consultant correct in the preliminary cost reduction assessment? Discuss actions that the company can take to reduce or eliminate the nonvalue-added activities. 3. Compute the unit cost required to maintain current market share, while earning a profit of 4 per unit. Now compute the unit cost required to expand sales by 50%, assuming a per-unit profit of 4. How much cost reduction would be required to achieve each unit cost? 4. Assume that further activity analysis revealed the following: switching to automated insertion would save 60,000 of engineering support and 90,000 of direct labor. Now, what is the total potential cost reduction per unit available from activity analysis? With these additional reductions, can Mays achieve the unit cost to maintain current sales? To increase it by 50%? What form of activity analysis is this: reduction, sharing, elimination, or selection? 5. CONCEPTUAL CONNECTION Calculate income based on current sales, prices, and costs. Then calculate the income by using a 14 price and a 12 price, assuming that the maximum cost reduction possible is achieved (including Requirement 4s reduction). What price should be selected?arrow_forwardKathy Shorts, president of Oliver Company, was concerned with the trend in sales and profitability. The company had been losing customers at an alarming rate. Furthermore, the company was barely breaking even. Investigation revealed that poor quality was at the root of the problem. At the end of 20x5, Kathy decided to begin a quality improvement program. As a first step, she identified the following costs in the accounting records as quality related: Required: 1. Prepare a quality cost report by quality cost category. 2. Calculate the relative distribution percentages for each quality cost category. Comment on the distribution. 3. Using the Taguchi loss function, an average loss per unit is computed to be 15 per unit. What are the hidden costs of external failure? How does this affect the relative distribution? 4. Shortss quality manager decided not to bother with the hidden costs. What do you think was his reasoning? Any efforts to reduce measured external failure costs will also reduce the hidden costs. Do you agree or disagree? Explain.arrow_forwardIn 20x5, Major Company initiated a full-scale, quality improvement program. At the end of the year, Jack Aldredge, the president, noted with some satisfaction that the defects per unit of product had dropped significantly compared to the prior year. He was also pleased that relationships with suppliers had improved and defective materials had declined. The new quality training program was also well accepted by employees. Of most interest to the president, however, was the impact of the quality improvements on profitability. To help assess the dollar impact of the quality improvements, the actual sales and the actual quality costs for 20x4 and 20x5 are as follows by quality category: All prevention costs are fixed (by discretion). Assume all other quality costs are unit-level variable. Required: 1. Compute the relative distribution of quality costs for each year and prepare a pie chart. Do you believe that the company is moving in the right direction in terms of the balance among the quality cost categories? Explain. 2. Prepare a one-year trend performance report for 20x5 (compare the actual costs of 20x5 with those of 20x4, adjusted for differences in sales volume). How much have profits increased because of the quality improvements made by Major Company? 3. Estimate the additional improvement in profits if Major Company ultimately reduces its quality costs to 2.5 percent of sales revenues (assume sales of 10 million).arrow_forward
 Principles of Accounting Volume 2AccountingISBN:9781947172609Author:OpenStaxPublisher:OpenStax College
 Managerial AccountingAccountingISBN:9781337912020Author:Carl Warren, Ph.d. Cma William B. TaylerPublisher:South-Western College Pub
 Cornerstones of Cost Management (Cornerstones Ser...AccountingISBN:9781305970663Author:Don R. Hansen, Maryanne M. MowenPublisher:Cengage Learning
 Essentials of Business Analytics (MindTap Course ...StatisticsISBN:9781305627734Author:Jeffrey D. Camm, James J. Cochran, Michael J. Fry, Jeffrey W. Ohlmann, David R. AndersonPublisher:Cengage Learning
 Managerial Accounting: The Cornerstone of Busines...AccountingISBN:9781337115773Author:Maryanne M. Mowen, Don R. Hansen, Dan L. HeitgerPublisher:Cengage Learning
 College Accounting (Book Only): A Career ApproachAccountingISBN:9781337280570Author:Scott, Cathy J.Publisher:South-Western College Pub