Financial and Managerial Accounting - CengageNow
15th Edition
ISBN: 9781337911979
Author: WARREN
Publisher: CENGAGE L
expand_more
expand_more
format_list_bulleted
Videos
Textbook Question
Chapter 27, Problem 4PB
Pareto chart and cost of quality report for a manufacturing company
The president of Mission Inc. has been concerned about the growth in costs over the last several years. The president asked the controller to perform an activity analysis to gain a better insight into these costs. The activity analysis revealed the following:
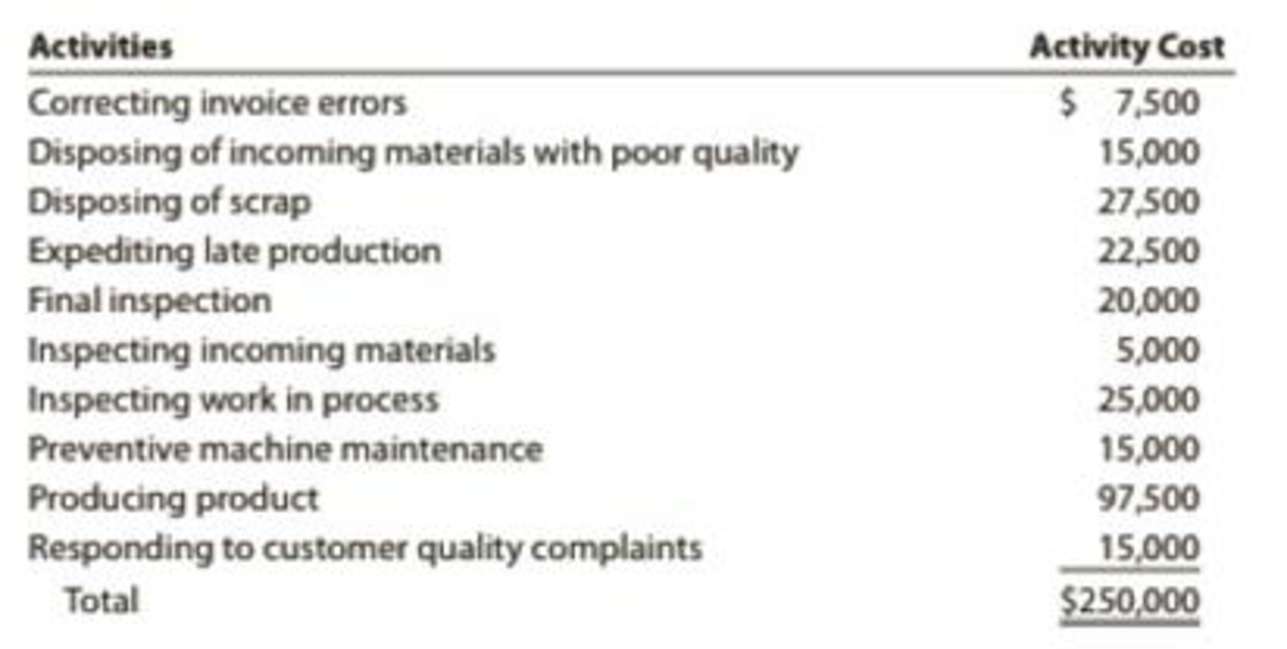
The production process is complicated by quality problems, requiring the production manager to expedite production and dispose of scrap.
Instructions
- 1. Prepare a Pareto chart of the company activities.
- 2. Classify the activities into prevention, appraisal, internal failure, external failure, and not costs of quality (producing product). Classify the activities into value-added and non-value-added activities.
- 3. Use the activity cost information to determine the percentages of total costs that are prevention, appraisal, internal failure, external failure, and not costs of quality.
- 4. Determine the percentages of total costs that are value-added and non-value-added.
- 5. Interpret the information.
Expert Solution & Answer

Trending nowThis is a popular solution!

Students have asked these similar questions
Pareto Chart and Cost of Quality Report for a Manufacturing Company
The president of Mission Inc. has been concerned about the growth in costs over the last several years. The president asked the controller to perform an activity analysis to gain a better insight into these costs. The activity analysis revealed the following.
The production process is complicated by quality problems, requiring the production manager to expedite production and dispose of scrap.
Required:
1. Classify the activities into prevention, appraisal, internal failure, external failure, and not costs of quality (producing product). Classify the activities into value-added and non-value added activities.
Activity
Activity Cost
Cost of Quality Classification
VA/NVA
Correcting invoice errors
$7,500
Disposing of incoming materials with poor quality
15,000
Disposing of scrap
27,500
Expediting late production
22,500
Final inspection
20,000
Inspecting incoming…
The following situations describe decision scenarios that could use managerial accounting information:
The manager of High Times Restaurant wishes to determine the price to charge for various lunch plates.
By evaluating the cost of leftover materials, the plant manager of a precision tool facility wishes to determine how effectively the plant is being run.
The division controller of West Coast Supplies needs to determine the cost of products left in inventory.
The manager of the Maintenance Department of a large manufacturing company wishes to plan next year’s anticipated expenditures. For each situation, discuss how managerial accounting information could be used.
b) What are the major differences between managerial accounting and financial accounting?
The president of Mission Inc. has been concerned about the growth in costs over the last several years. The president asked the controller to perform an activity analysis to gain a better insight into these costs. The activity analysis revealed the following:
Activities
Activity Cost
Correcting invoice errors
$8,500
Disposing of income materials with poor quality
16,000
Disposing of scrap
28,500
Expediting late production
21,500
Final inspection
19,000
Inspecting incoming materials
5,000
Inspecting work in process
25,000
Preventive machine maintenance
15,000
Producing product
95,500
Responding to customer quality complaints
15,000
Total
249,000
The production process is complicated by quality problems, requiring the production manager to expedite production and dispose of scrap.
Prepare a Pareto chart of the company activities.
Classify the activities into prevention, appraisal, internal failure,…
Chapter 27 Solutions
Financial and Managerial Accounting - CengageNow
Ch. 27 - What is the benefit of the lean philosophy?Ch. 27 - What are some examples of non-value-added lead...Ch. 27 - Why is a product-oriented layout preferred by lean...Ch. 27 - How is setup time related to lead time?Ch. 27 - Why do lean manufacturers favor pull or make to...Ch. 27 - Why would a lean manufacturer strive to produce...Ch. 27 - How is supply chain management different from...Ch. 27 - Why does lean accounting result in fewer...Ch. 27 - Why do lean manufacturers use a raw and in process...Ch. 27 - Why is the direct labor cost category eliminated...
Ch. 27 - Prob. 11DQCh. 27 - What is the benefit of identifying non-value-added...Ch. 27 - In what ways can the cost of a process be...Ch. 27 - Lead time Blues Inc. manufactures jeans in the...Ch. 27 - Prob. 2BECh. 27 - Lean accounting The annual budgeted conversion...Ch. 27 - Cost of quality report A quality control activity...Ch. 27 - Process activity analysis Roen Company incurred an...Ch. 27 - Lean principles The chief executive officer (CEO)...Ch. 27 - Prob. 2ECh. 27 - Lean principles Rag Swag Inc. manufactures various...Ch. 27 - Lead time analysis Furry Friends Inc. manufactures...Ch. 27 - Reduce setup time Vernon Inc. has analyzed the...Ch. 27 - Compute lead time Jackson Fabricators Inc....Ch. 27 - Calculate lead time Williams Optical Inc. is...Ch. 27 - Suppy chain management The following is an excerpt...Ch. 27 - Employee involvement Quickie Designs Inc. uses...Ch. 27 - Lean principles for a restaurant The management of...Ch. 27 - Accounting issues in a lean environment Eon...Ch. 27 - Lean accounting Westgate Inc. uses a lean...Ch. 27 - Lean accounting Modern Lighting Inc. manufactures...Ch. 27 - Lean accounting Vintage Audio Inc. manufactures...Ch. 27 - Pareto chart Meagher Solutions Inc. manufactures...Ch. 27 - Cost of quality report A. Using the information in...Ch. 27 - Pareto chart for a service company Three Rivers...Ch. 27 - Cost of quality and value-added/non-value-added...Ch. 27 - Process activity analysis The Brite Beverage...Ch. 27 - Process activity analysis for a service company...Ch. 27 - Prob. 21ECh. 27 - Lean principles Bright Night, Inc., manufactures...Ch. 27 - Lead time Sound Tek Inc. manufactures electronic...Ch. 27 - Lean accounting Dashboard Inc. manufactures and...Ch. 27 - Pareto chart and cost of quality report for a...Ch. 27 - Prob. 1PBCh. 27 - Lead time Master Chef Appliance Company...Ch. 27 - Lean accounting Com-Tel Inc. manufactures and...Ch. 27 - Pareto chart and cost of quality report for a...Ch. 27 - Make a Decision Lean Performance for...Ch. 27 - Prob. 2MADCh. 27 - Prob. 3MADCh. 27 - Prob. 4MADCh. 27 - Ethics in Action In August, Lannister Company...Ch. 27 - Communication Ethan Fromme, the chief financial...Ch. 27 - Leese Inc. has the following quality financial...Ch. 27 - When measuring the cost of quality, the cost of...Ch. 27 - In measuring the cost of quality, which one of the...Ch. 27 - External failure costs include all of the...
Knowledge Booster


Learn more about
Need a deep-dive on the concept behind this application? Look no further. Learn more about this topic, accounting and related others by exploring similar questions and additional content below.Similar questions
- The president of Mission Inc. has been concerned about the growth in costs over the last several years. The president asked the controller to perform an activity analysis to gain a better insight into these costs. The activity analysis revealed the following:arrow_forwardMethod of Least Squares, Predicting Cost for Different Time Periods from the One Used to Develop a Cost Formula Farnsworth Company has gathered data on its overhead activities and associated costs for the past 10 months. Tracy Heppler, a member of the controller's department, has convinced management that overhead costs can be better estimated and controlled if the fixed and variable components of each overhead activity are known. One such activity is receiving raw materials (unloading incoming goods, counting goods, and inspecting goods), which she believes is driven by the number of receiving orders. Ten months of data have been gathered for the receiving activity and are as follows: Month Receiving Orders Receiving Cost 1 1,000 $18,000 2 700 $15,000 3 1,500 $28,000 4 1,200 $17,000 5 1,300 $25,000 6 1,100 $21,000 7 1,600 $29,000 8 1,400 $24,000 9 1,700 $27,000 10 900 $16,000 Assume that Tracy…arrow_forwardArklan Production is upgrading its manufacturing process from a manual process to a highly automated system. Management believes that the new system will result in greater efficiencies and a better finished product. Arklan is also working on a plan to downsize staff after the implementation of the new system. Arklan has used a traditional absorption costing system to calculate unit product costs for external financial reporting. In the past, Arklan has allocated its manufacturing overhead costs using a predetermined plant-wide overhead rate based on direct labor hours. The controller realizes that the new system may require changing the overhead allocation process. Management plans to take the opportunity to reconsider other improvements to the costing system. Identify and explain three benefits of using departmental overhead rates to allocate overhead costs. Explain the difference between absorption costing and variable costing. Identify which is more suitable for internal…arrow_forward
- Scattergraph, High–Low Method, and Predicting Cost for a Different Time Period from the One Used to Develop a Cost Formula Farnsworth Company has gathered data on its overhead activities and associated costs for the past 10 months. Tracy Heppler, a member of the controller's department, has convinced management that overhead costs can be better estimated and controlled if the fixed and variable components of each overhead activity are known. One such activity is receiving raw materials (unloading incoming goods, counting goods, and inspecting goods), which she believes is driven by the number of receiving orders. Ten months of data have been gathered for the receiving activity and are as follows: Month Receiving Orders Receiving Cost ($) 1 1,000 27,000 2 700 22,500 3 1,500 42,000 4 1,200 25,500 5 1,300 37,500 6 1,100 31,500 7 1,600 43,500 8 1,400 36,000 9 1,700 40,500 10 900 24,000 Required: 1. On your own paper, prepare a scattergraph based on the 10…arrow_forwardasked that you review the company's costing system and "do what you can to help us get better control of our manufacturing overhead costs." You find that the company has never used a flexible budget, and you suggest that preparing such a budget would be an excellent first step in overhead planning and control. After much effort and analysis, you determined the following cost formulas and gathered the following actual cost data for March: Utilities Maintenance Supplies Indirect labor Depreciation Cost Formula $16,000+ $0.19 per machine-hour $38,900 $1.30 per machine-hour $0.40 per machine-hour $94,000+ $1.20 per machine-hour $67,500 Actual Cost in March $ 22,390 Required: 1. Calculate the activity variances for March. 2. Calculate the spending variances for March. $60,000 $ 8,200 $120, 100 $ 69,200 During March, the company worked 19,000 machine-hours and produced 13,000 units. The company had originally planned to work 21,000 machine-hours during March.arrow_forwardRequired information [The following information applies to the questions displayed below.] Rusties Company recently implemented an activity-based costing system. At the beginning of the year, management made the following estimates of cost and activity in the company's five activity cost pools: Activity Cost Pool Labor-related Purchase orders Product testing Template etching General factory Activity Cost Pool Labor-related (DLHS) Activity Measure Product A Product B Product C Product D Direct labor-hours Number of orders Number of tests Number of templates Machine-hours Total Overhead Cost Expected Overhead Cost $ 30,115 $ 2,320 $ 6,930 $ 870 $ 65,100 2. The expected activity for the year was distributed among the company's four products as follows: Product A 625 30 190 Expected Activity 1,585 DLHS Product B 160 Purchase orders (orders) 190 Product testing (tests) 55 Template etching (templates) 17 3 General factory (MHS) 3,600 1,700 2,300 Using the ABC data, determine the total amount…arrow_forward
- Cost Classification and Behaviour—Spark Electrical Company Spark Electrical Company manufactures electrical components. Plant management has experienced difficulties with fluctuating monthly overhead costs. Management wants to be able to estimate overhead costs to plan its operations and financial needs. A trade association publication reports that for companies manufacturing electrical components, overhead tends to vary with machine hours. Monthly data was gathered on machine hours and overhead costs for the past two years. There were no major changes in operations over this period of time. The raw data is: Month Number Machine Hours Overhead Costs ($) 1 20,000 84,000 2 25,000 99,000 3 22,000 89,500 4 23,000 90,000 5 20,000 81,500 6 19,000 75,500 7 14,000 70,500 8 10,000 64,500 9 12,000 69,000 10 17,000 75,000 11 16,000 71,500 12 19,000 78,000 13 21,000 86,000 14 24,000 93,000 15 23,000 93,000 16 22,000 87,000 17 20,000 80,000…arrow_forwardThe company uses a traditional costing system in assigning overhead costs to the products on the basis of direct labour hours. However, the Production Manager seeks to replace the existing system with the Activity-based Costing (ABC) system to keep control over costs and offer more competitive pricing. After reviewing the existing costing system and interviewing the company’s personnel in relevant departments, the accountant compiled a report highlighting resources and costs involved in manufacturing watches per month: The following table lists out the overhead cost: Activity cost pool Overhead cost (£) Additional Notes Job-order set up 33,000 Procurement and placement 360,000 Installation of winding system 195,000 An auto winding system is fitted with every watch Quality inspection (machine) 60,000 Quality inspection (manual) 21,000 Finishing 140,000 Hand-made finishing Packaging and delivery 44,250 The…arrow_forwardThe Westfield branch of Security Home Bank submitted the following cost data for last year: Teller wages Assistant branch manager salary Branch manager salary Total Virtually all other costs of the branch-rent, depreciation, utilities, and so on-are organization-sustaining costs that cannot be meaningfully assigned to individual customer transactions such as depositing checks. In addition to the cost data above, the employees of the Westfield branch were interviewed concerning how their time was distributed last year across the activities included in the activity-based costing study. The results of those interviews appear below: Teller wages Assistant branch manager salary Branch manager salary $ 144,000 74,000 90,000 $ 308,000 Activity Opening accounts Processing deposits and withdrawals Processing other customer transactions Distribution of Resource Consumption Across Activities Processing Deposits and Withdrawals 75% 15% 0% Opening Accounts 4% 15% 4% Activity Cost Pool Opening…arrow_forward
- The management of Wheeler Company has decided to develop cost formulas for its major overhead activities. Wheeler uses a highly automated manufacturing process, and power costs are a significant manufacturing cost. Cost analysts have decided that power costs are mixed; thus, they must be broken into their fixed and variable elements so that the cost behavior of the power usage activity can be properly described. Machine hours have been selected as the activity driver for power costs. The following data for the past eight quarters have been collected: Required: 1. Prepare a scattergraph by plotting power costs against machine hours. Does the scatter-graph show a linear relationship between machine hours and power cost? 2. Using the high and low points, compute a power cost formula. 3. Use the method of least squares to compute a power cost formula. Evaluate the coefficient of determination. 4. Rerun the regression and drop the point (20,000; 26,000) as an outlier. Compare the results from this regression to those for the regression in Requirement 3. Which is better?arrow_forwardRandy Harris, controller, has been given the charge to implement an advanced cost management system. As part of this process, he needs to identify activity drivers for the activities of the firm. During the past four months, Randy has spent considerable effort identifying activities, their associated costs, and possible drivers for the activities costs. Initially, Randy made his selections based on his own judgment using his experience and input from employees who perform the activities. Later, he used regression analysis to confirm his judgment. Randy prefers to use one driver per activity, provided that an R2 of at least 80 percent can be produced. Otherwise, multiple drivers will be used, based on evidence provided by multiple regression analysis. For example, the activity of inspecting finished goods produced an R2 of less than 80 percent for any single activity driver. Randy believes, however, that a satisfactory cost formula can be developed using two activity drivers: the number of batches and the number of inspection hours. Data collected for a 14-month period are as follows: Required: 1. Calculate the cost formula for inspection costs using the two drivers, inspection hours and number of batches. Are both activity drivers useful? What does the R2 indicate about the formula? 2. Using the formula developed in Requirement 1, calculate the inspection cost when 300 inspection hours are used and 30 batches are produced. Prepare a 90 percent confidence interval for this prediction.arrow_forwardCommunication The controller of New Wave Sounds Inc. prepared the following product profitability report for management, using activity-based costing methods for allocating both the factory overhead and the marketing expenses. As such, the controller has confidence in the accuracy of this report. In addition, the controller interviewed the vice president of marketing, who provided the following insight into the companys three products: The home theater speakers are an older product that is highly recognized in the marketplace. The wireless speakers are a new product that was just recently launched. The wireless headphones are a new technology that has no competition in the marketplace, and it is hoped that they will become an important future addition to the companys product portfolio. Initial indications are that the product is well received by customers. The controller believes that the manufacturing costs for all three products are in line with expectations. Based on the information provided: 1. Calculate the ratio of gross profit to sales and the ratio of operating income to sales for each product. 2. Write a brief (one-page) memo using the product profitability report and the calculations in (a) to make recommendations to management with respect to strategies for the three products.arrow_forward
arrow_back_ios
arrow_forward_ios
Recommended textbooks for you
 Financial And Managerial AccountingAccountingISBN:9781337902663Author:WARREN, Carl S.Publisher:Cengage Learning,
 Managerial AccountingAccountingISBN:9781337912020Author:Carl Warren, Ph.d. Cma William B. TaylerPublisher:South-Western College Pub
 Cornerstones of Cost Management (Cornerstones Ser...AccountingISBN:9781305970663Author:Don R. Hansen, Maryanne M. MowenPublisher:Cengage Learning
Financial And Managerial Accounting
Accounting
ISBN:9781337902663
Author:WARREN, Carl S.
Publisher:Cengage Learning,
Managerial Accounting
Accounting
ISBN:9781337912020
Author:Carl Warren, Ph.d. Cma William B. Tayler
Publisher:South-Western College Pub
Cornerstones of Cost Management (Cornerstones Ser...
Accounting
ISBN:9781305970663
Author:Don R. Hansen, Maryanne M. Mowen
Publisher:Cengage Learning
alue Chain Analysis EXPLAINED | B2U | Business To You; Author: Business To You;https://www.youtube.com/watch?v=SI5lYaZaUlg;License: Standard Youtube License