
Financial And Managerial Accounting
15th Edition
ISBN: 9781337902663
Author: WARREN, Carl S.
Publisher: Cengage Learning,
expand_more
expand_more
format_list_bulleted
Videos
Textbook Question
thumb_up100%
Chapter 18, Problem 3TIF
Communication
The controller of New Wave Sounds Inc. prepared the following product profitability report for management, using activity-based costing methods for allocating both the factory overhead and the marketing expenses. As such, the controller has confidence in the accuracy of this report.
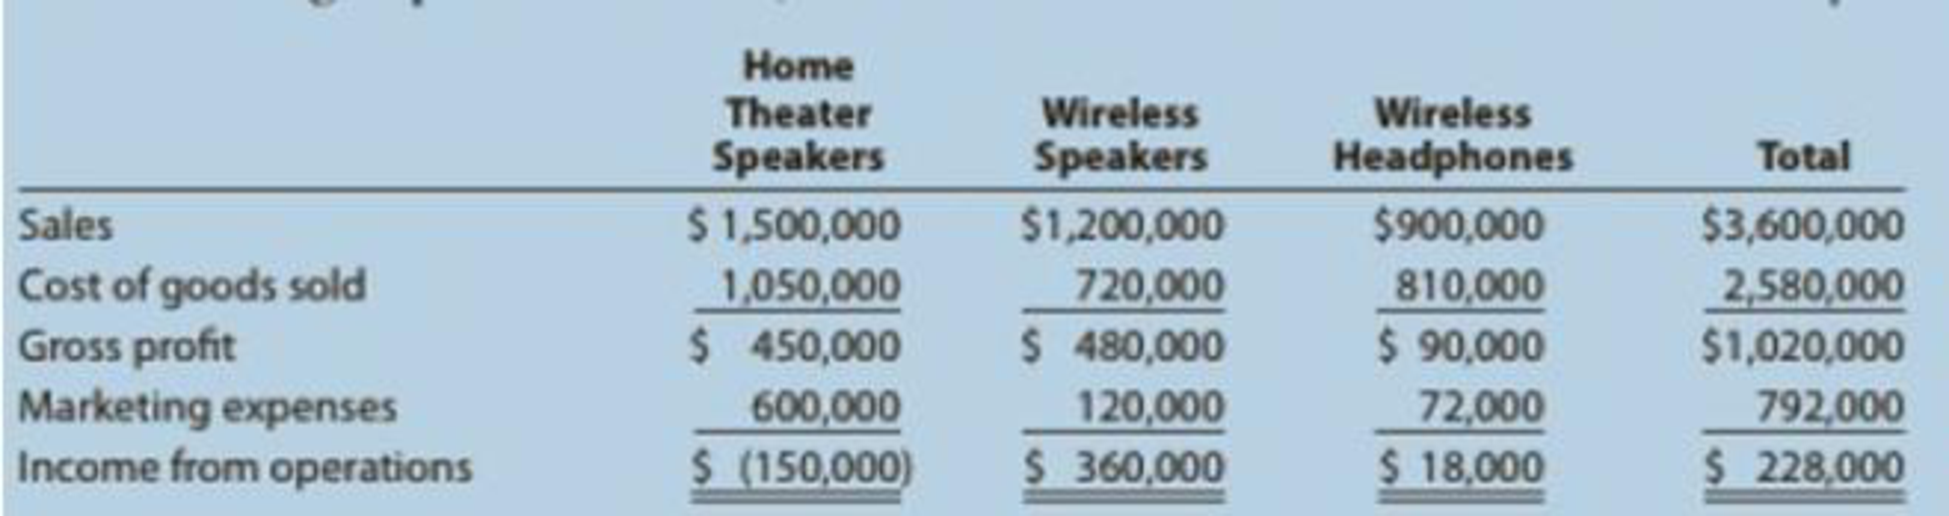
In addition, the controller interviewed the vice president of marketing, who provided the following insight into the company’s three products:
- The home theater speakers are an older product that is highly recognized in the marketplace.
- The wireless speakers are a new product that was just recently launched.
- The wireless headphones are a new technology that has no competition in the marketplace, and it is hoped that they will become an important future addition to the company’s product portfolio. Initial indications are that the product is well received by customers.
The controller believes that the
Based on the information provided:
- 1. Calculate the ratio of gross profit to sales and the ratio of operating income to sales for each product.
- 2. Write a brief (one-page) memo using the product profitability report and the calculations in (a) to make recommendations to management with respect to strategies for the three products.
Expert Solution & Answer

Trending nowThis is a popular solution!

Chapter 18 Solutions
Financial And Managerial Accounting
Ch. 18 - Why would management be concerned about the...Ch. 18 - Why would a manufacturing company with multiple...Ch. 18 - How do the multiple production department and the...Ch. 18 - Under what two conditions would the multiple...Ch. 18 - How does activity-based costing differ from the...Ch. 18 - Shipping, selling, marketing, sales order...Ch. 18 - Prob. 7DQCh. 18 - Under what circumstances might the activity-based...Ch. 18 - When might activity-based costing be preferred...Ch. 18 - Prob. 10DQ
Ch. 18 - Single plantwide factory overhead rate The total...Ch. 18 - Multiple production department factory overhead...Ch. 18 - Activity-based costing: factory overhead costs The...Ch. 18 - Activity-based costing: selling and administrative...Ch. 18 - Activity-based costing for a service business...Ch. 18 - Kennedy Appliance Inc.s Machining Department...Ch. 18 - Bach Instruments Inc. makes three musical...Ch. 18 - Scrumptious Snacks Inc. manufactures three types...Ch. 18 - Isaac Engines Inc. produces three productspistons,...Ch. 18 - Handy Leather, Inc., produces three sizes of...Ch. 18 - Eclipse Motor Company manufactures two types of...Ch. 18 - The management of Nova Industries Inc....Ch. 18 - Comfort Foods Inc. uses activity-based costing to...Ch. 18 - Nozama.com Inc. sells consumer electronics over...Ch. 18 - Hercules Inc. manufactures elliptical exercise...Ch. 18 - Lonsdale Inc. manufactures entry and dining room...Ch. 18 - Activity cost pools, activity rates, and product...Ch. 18 - Handbrain Inc. is considering a change to...Ch. 18 - Prob. 14ECh. 18 - Activity-based costing and product cost distortion...Ch. 18 - Single plantwide rate and activity-based costing...Ch. 18 - Evaluating selling and administrative cost...Ch. 18 - Construct and interpret a product profitability...Ch. 18 - Metroid Electric manufactures power distribution...Ch. 18 - Activity-based costing for a service company...Ch. 18 - Bounce Back Insurance Company carries three major...Ch. 18 - Gwinnett County Chrome Company manufactures three...Ch. 18 - The management of Gwinnett County Chrome Company,...Ch. 18 - Activity-based and department rate product costing...Ch. 18 - Activity-based product costing Mello Manufacturing...Ch. 18 - Allocating selling and administrative expenses...Ch. 18 - Product costing and decision analysis for a...Ch. 18 - Single plantwide factory overhead rate Spotted Cow...Ch. 18 - Multiple production department factory overhead...Ch. 18 - Activity-based department rate product costing and...Ch. 18 - Activity-based product costing Sweet Sugar Company...Ch. 18 - Allocating selling and administrative expenses...Ch. 18 - Product costing and decision analysis for a...Ch. 18 - Life Force Fitness, Inc., assembles and sells...Ch. 18 - Activity-based product cost improvement Gourmet...Ch. 18 - Labor classification trade-off Skidmore...Ch. 18 - Production run size and activity improvement...Ch. 18 - Hospital activity-based costing analysis Lancaster...Ch. 18 - Ethics in Action The controller of Tri Con Global...Ch. 18 - Communication The controller of New Wave Sounds...Ch. 18 - Pelder Products Company manufactures two types of...Ch. 18 - The Chocolate Baker specializes in chocolate baked...Ch. 18 - Young Company is beginning operations and is...Ch. 18 - Cynthia Rogers, the cost accountant for Sanford...
Knowledge Booster


Learn more about
Need a deep-dive on the concept behind this application? Look no further. Learn more about this topic, accounting and related others by exploring similar questions and additional content below.Similar questions
- Pareto chart and cost of quality report for a manufacturing company The president of Mission Inc. has been concerned about the growth in costs over the last several years. The president asked the controller to perform an activity analysis to gain a better insight into these costs. The activity analysis revealed the following: The production process is complicated by quality problems, requiring the production manager to expedite production and dispose of scrap. Instructions 1. Prepare a Pareto chart of the company activities. 2. Classify the activities into prevention, appraisal, internal failure, external failure, and not costs of quality (producing product). Classify the activities into value-added and non-value-added activities. 3. Use the activity cost information to determine the percentages of total costs that are prevention, appraisal, internal failure, external failure, and not costs of quality. 4. Determine the percentages of total costs that are value-added and non-value-added. 5. Interpret the information.arrow_forwardThe Chocolate Baker specializes in chocolate baked goods. The firm has long assessed the profitability of a product line by comparing revenues to the cost of goods sold. However, Barry White, the firms new accountant, wants to use an activity-based costing system that takes into consideration the cost of the delivery person. Following are activity and cost information relating to two of Chocolate Bakers major products: Using activity-based costing, which of the following statements is correct? a. The muffins are 2,000 more profitable. b. The cheesecakes are 75 more profitable. c. The muffins are 1,925 more profitable. d. The muffins have a higher profitability as a percentage of sales and, therefore, are more advantageous.arrow_forwardAnalyze Horsepower Hookup, Inc. Horsepower Hookup, Inc., is a large automobile company that specializes in the production of high-powered trucks. The company is determining cost allocations for purposes of performance evaluation. A portion of company bonuses depends on divisions achieving cost management goals. This necessitates highly accurate support department cost allocation. Management has also stated that it has the means to implement as complex a method as necessary. The general manager over the Mid-Size D wants to get a good idea of what factors are driving the costs of the support departments in order to make accurate cost allocations, so finding accurate support department cost drivers is important. Support department costs include Janitorial (163,100) and Security (285,400). The Janitorial costs vary depending on the number of vehicles produced, increasing with larger production volumes. Security costs are fixed based on the size of the lot, and do not change with respect to how many vehicles are in the lot or warehouse. Joint costs involved in producing the trucks before the split-off point where the various makes, models, and colors are produced are 946,000 for the period. All makes, models, and colors sell at relatively similar margins, but the sports models and metallic colors are normally more difficult to produce during the joint production process. a. Which support department cost allocation method (direct, sequential, or reciprocal services) should be used to allocate support department cost? b. What driver would be best for allocating Janitorial costs? c. What driver would be best for allocating Security costs? d. If Janitorial costs were to be allocated based on square footage, and Security costs based on asset value, what percentage of each support departments costs would be allocated to each production department using the sequential method (allocating Security costs first) given the following: e. Should Janitorial and Security costs be considered when evaluating the performance of cost management employees? f. What joint cost allocation method should be used for performance evaluation purposes?arrow_forward
- Tom Young, vice president of Dunn Company (a producer of plastic products), has been supervising the implementation of an activity-based cost management system. One of Toms objectives is to improve process efficiency by improving the activities that define the processes. To illustrate the potential of the new system to the president, Tom has decided to focus on two processes: production and customer service. Within each process, one activity will be selected for improvement: molding for production and sustaining engineering for customer service. (Sustaining engineers are responsible for redesigning products based on customer needs and feedback.) Value-added standards are identified for each activity. For molding, the value-added standard calls for nine pounds per mold. (Although the products differ in shape and function, their size, as measured by weight, is uniform.) The value-added standard is based on the elimination of all waste due to defective molds (materials is by far the major cost for the molding activity). The standard price for molding is 15 per pound. For sustaining engineering, the standard is 60 percent of current practical activity capacity. This standard is based on the fact that about 40 percent of the complaints have to do with design features that could have been avoided or anticipated by the company. Current practical capacity (the first year) is defined by the following requirements: 18,000 engineering hours for each product group that has been on the market or in development for five years or less, and 7,200 hours per product group of more than five years. Four product groups have less than five years experience, and 10 product groups have more. There are 72 engineers, each paid a salary of 70,000. Each engineer can provide 2,000 hours of service per year. There are no other significant costs for the engineering activity. For the first year, actual pounds used for molding were 25 percent above the level called for by the value-added standard; engineering usage was 138,000 hours. There were 240,000 units of output produced. Tom and the operational managers have selected some improvement measures that promise to reduce non-value-added activity usage by 30 percent in the second year. Selected actual results achieved for the second year are as follows: The actual prices paid per pound and per engineering hour are identical to the standard or budgeted prices. Required: 1. For the first year, calculate the non-value-added usage and costs for molding and sustaining engineering. Also, calculate the cost of unused capacity for the engineering activity. 2. Using the targeted reduction, establish kaizen standards for molding and engineering (for the second year). 3. Using the kaizen standards prepared in Requirement 2, compute the second-year usage variances, expressed in both physical and financial measures, for molding and engineering. (For engineering, explain why it is necessary to compare actual resource usage with the kaizen standard.) Comment on the companys ability to achieve its targeted reductions. In particular, discuss what measures the company must take to capture any realized reductions in resource usage.arrow_forwardJolene Askew, manager of Feagan Company, has committed her company to a strategically sound cost reduction program. Emphasizing life-cycle cost management is a major part of this effort. Jolene is convinced that production costs can be reduced by paying more attention to the relationships between design and manufacturing. Design engineers need to know what causes manufacturing costs. She instructed her controller to develop a manufacturing cost formula for a newly proposed product. Marketing had already projected sales of 25,000 units for the new product. (The life cycle was estimated to be 18 months. The company expected to have 50 percent of the market and priced its product to achieve this goal.) The projected selling price was 20 per unit. The following cost formula was developed: Y=200,000+10X1 where X1=Machinehours(Theproductisexpectedtouseonemachinehourforeveryunitproduced.) Upon seeing the cost formula, Jolene quickly calculated the projected gross profit to be 50,000. This produced a gross profit of 2 per unit, well below the targeted gross profit of 4 per unit. Jolene then sent a memo to the Engineering Department, instructing them to search for a new design that would lower the costs of production by at least 50,000 so that the target profit could be met. Within two days, the Engineering Department proposed a new design that would reduce unit-variable cost from 10 per machine hour to 8 per machine hour (Design Z). The chief engineer, upon reviewing the design, questioned the validity of the controllers cost formula. He suggested a more careful assessment of the proposed designs effect on activities other than machining. Based on this suggestion, the following revised cost formula was developed. This cost formula reflected the cost relationships of the most recent design (Design Z). Y=140,000+8X1+5,000X2+2,000X3 where X1=MachinehoursX2=NumberofbatchesX3=Numberofengineeringchangeorders Based on scheduling and inventory considerations, the product would be produced in batches of 1,000; thus, 25 batches would be needed over the products life cycle. Furthermore, based on past experience, the product would likely generate about 20 engineering change orders. This new insight into the linkage of the product with its underlying activities led to a different design (Design W). This second design also lowered the unit-level cost by 2 per unit but decreased the number of design support requirements from 20 orders to 10 orders. Attention was also given to the setup activity, and the design engineer assigned to the product created a design that reduced setup time and lowered variable setup costs from 5,000 to 3,000 per setup. Furthermore, Design W also creates excess activity capacity for the setup activity, and resource spending for setup activity capacity can be decreased by 40,000, reducing the fixed cost component in the equation by this amount. Design W was recommended and accepted. As prototypes of the design were tested, an additional benefit emerged. Based on test results, the post-purchase costs dropped from an estimated 0.70 per unit sold to 0.40 per unit sold. Using this information, the Marketing Department revised the projected market share upward from 50 percent to 60 percent (with no price decrease). Required: 1. Calculate the expected gross profit per unit for Design Z using the controllers original cost formula. According to this outcome, does Design Z reach the targeted unit profit? Repeat, using the engineers revised cost formula. Explain why Design Z failed to meet the targeted profit. What does this say about the use of unit-based costing for life-cycle cost management? 2. Calculate the expected profit per unit using Design W. Comment on the value of activity information for life-cycle cost management. 3. The benefit of the post-purchase cost reduction of Design W was discovered in testing. What direct benefit did it create for Feagan Company (in dollars)? Reducing post-purchase costs was not a specific design objective. Should it have been? Are there any other design objectives that should have been considered?arrow_forwardJoseph Fox, controller of Thorpe Company, has been in charge of a project to install an activity-based cost management system. This new system is designed to support the companys efforts to become more competitive. For the past six weeks, he and the project committee members have been identifying and defining activities, associating workers with activities, and assessing the time and resources consumed by individual activities. Now, he and the project committee are focusing on three additional implementation issues: (1) identifying activity drivers, (2) assessing value content, and (3) identifying cost drivers (root causes). Joseph has assigned a committee member the responsibilities of assessing the value content of five activities, choosing a suitable activity driver for each activity, and identifying the possible root causes of the activities. Following are the five activities with possible activity drivers: The committee member ran a regression analysis for each potential activity driver, using the method of least squares to estimate the variable and fixed cost components. In all five cases, costs were highly correlated with the potential drivers. Thus, all drivers appeared to be good candidates for assigning costs to products. The company plans to reward production managers for reducing product costs. Required: 1. What is the difference between an activity driver and a cost driver? In answering the question, describe the purpose of each type of driver. 2. For each activity, assess the value content and classify each activity as value-added or non-value-added (justify the classification). Identify some possible root causes of each activity, and describe how this knowledge can be used to improve activity performance. For purposes of discussion, assume that the value-added activities are not performed with perfect efficiency. 3. Describe the behavior that each activity driver will encourage, and evaluate the suitability of that behavior for the companys objective of becoming more competitive.arrow_forward
- John Thomas, vice president of Mallett Company (a producer of a variety of plastic products), has been supervising the implementation of an ABC management system. John wants to improve process efficiency by improving the activities that define the processes. To illustrate the potential of the new system to the president, John has decided to focus on two processes: production and customer service. Within each process, one activity will be selected for improvement: materials usage for production and sustaining engineering for customer service (sustaining engineers are responsible for redesigning products based on customer needs and feedback). Value-added standards are identified for each activity. For materials usage, the value-added standard calls for six pounds per unit of output (the products differ in shape and function, but their weight is uniform). The value-added standard is based on the elimination of all waste due to defective molds. The standard price of materials is 5 per pound. For sustaining engineering, the standard is 58% of current practical activity capacity. This standard is based on the fact that about 42% of the complaints have to do with design features that could have been avoided or anticipated by the company. Current practical capacity (at the end of 20X1) is defined by the following requirements: 6,000 engineering hours for each product group that has been on the market or in development for 5 years or less and 2,400 hours per product group of more than 5 years. Four product groups have less than 5 years experience, and 10 product groups have more. Each of the 24 engineers is paid a salary of 60,000. Each engineer can provide 2,000 hours of service per year. No other significant costs are incurred for the engineering activity. Actual materials usage for 20X1 was 25% above the level called for by the value-added standard; engineering usage was 46,000 hours. A total of 80,000 units of output were produced. John and the operational managers have selected some improvement measures that promise to reduce nonvalue-added activity usage by 40% in 20X2. Selected actual results achieved for 20X2 are as follows: The actual prices paid for materials and engineering hours are identical to the standard or budgeted prices. Required: 1. For 20X1, calculate the nonvalue-added usage and costs for materials usage and sustaining engineering. 2. CONCEPTUAL CONNECTION Using the budgeted improvements, calculate the expected activity usage levels for 20X2. Now, compute the 20X2 usage variances (the difference between the expected and actual values), expressed in both physical and financial measures, for materials and engineering. Comment on the companys ability to achieve its targeted reductions. In particular, discuss what measures the company must take to capture any realized reductions in resource usage.arrow_forwardEvaluating selling and administrative cost allocations Gordon Gecco Furniture Company has two major product lines with the following characteristics: Commercial office furniture: Few large orders, little advertising support, shipments in full truckloads, and low handling complexity Home office furniture: Many small orders, large advertising support, shipments in partial truckloads, and high handling complexity The company produced the following profitability report for management: The selling and administrative expenses are allocated to the products on the basis of relative sales dollars. Evaluate the accuracy of this report and recommend an alternative approach.arrow_forwardRandy Harris, controller, has been given the charge to implement an advanced cost management system. As part of this process, he needs to identify activity drivers for the activities of the firm. During the past four months, Randy has spent considerable effort identifying activities, their associated costs, and possible drivers for the activities costs. Initially, Randy made his selections based on his own judgment using his experience and input from employees who perform the activities. Later, he used regression analysis to confirm his judgment. Randy prefers to use one driver per activity, provided that an R2 of at least 80 percent can be produced. Otherwise, multiple drivers will be used, based on evidence provided by multiple regression analysis. For example, the activity of inspecting finished goods produced an R2 of less than 80 percent for any single activity driver. Randy believes, however, that a satisfactory cost formula can be developed using two activity drivers: the number of batches and the number of inspection hours. Data collected for a 14-month period are as follows: Required: 1. Calculate the cost formula for inspection costs using the two drivers, inspection hours and number of batches. Are both activity drivers useful? What does the R2 indicate about the formula? 2. Using the formula developed in Requirement 1, calculate the inspection cost when 300 inspection hours are used and 30 batches are produced. Prepare a 90 percent confidence interval for this prediction.arrow_forward
- Communications Jamarcus Bradshaw, plant manager of Georgia Paper Companys papermaking mill, was looking over the cost of production reports for July and August for the Papermaking Department. The reports revealed the following: Jamarcus was concerned about the increased cost per ton from the output of the department. As a result, he asked the plant controller to perform a study to help explain these results. The controller, Leann Brunswick, began the analysis by performing some interviews of key plant personnel in order to understand what the problem might be. Excerpts from an interview with Len Tyson, a paper machine operator, follow: Len: We have two papermaking machines in the department. I have no data, but I think paper machine No. 1 is applying too much pulp and, thus, is wasting both conversion and materials resources. We haven't had repairs on paper machine No. 1 in a while. Maybe this is the problem. Leann: How does too much pulp result in wasted resources? Len: Well, you see, if too much pulp is applied, then we will waste pulp material. The customer will not pay for the extra product; we just use more material to make the product. Also, when there is too much pulp, the machine must be slowed down in order to complete the drying process. This results in additional conversion costs. Leann: Do you have any other suspicions? Len: Well, as you know, we have two productsgreen paper and yellow paper. They are identical except for the color. The color is added to the papermaking process in the paper machine. I think that during August these two color papers have been behaving very differently. I don't have any data, but it just seems as though the amount of waste associated with the green paper has increased. Leann: Why is this? Len: I understand that there has been a change in specifications for the green paper, starting near the beginning of August. This change could be causing the machines to run poorly when making green paper. If this is the case, the cost per ton would increase for green paper. Leann also asked for a database printout providing greater detail on Augusts operating results. September 9 Requested by: Leann Brunswick Papermaking DepartmentAugust detail Prior to preparing a report, Leann resigned from Georgia Paper Company to start her own business. You have been asked to take the data that Leann collected, and write a memo to Jamarcus Bradshaw with a recommendation to management. Your memo should include analysis of the August data to determine whether the paper machine or the paper color explains the increase in the unit cost from July. Include any supporting schedules that are appropriate. Round any calculations to the nearest cent.arrow_forwardSupport department cost allocation Blue Mountain Masterpieces produces pictures, paintings, and other home decor. The Printing and Framing production departments are supported by the Janitorial and Security departments. Janitorial costs are allocated to the production departments based on square feet, and security costs are allocated based on asset value. Information about these departments is detailed in the following table: Management has experimented with different support department cost allocation methods in the past. The different allocation methods did not yield large differences of cost allocation to the production departments. Instructions 1. Determine which support department cost allocation method Blue Mountain Masterpieces would most likely use to allocate its support department costs to the production departments. 2. Determine the total costs allocated from each support department to each production department using the method you determined in part (1). 3. Without doing calculations, consider and answer the following: If Blue Mountain Masterpieces decided to use square feet instead of asset value as the cost driver for security services, how would this change the allocation of Security Department costs?arrow_forwardVentana Window and Wall Treatments Company provides draperies, shades, and various window treatments. Ventana works with the customer to design the appropriate window treatment, places the order, and installs the finished product. Direct materials and direct labor costs are easy to trace to the jobs. Ventanas income statement for last year is as follows: Ventana wants to find a markup on cost of goods sold that will allow them to earn about the same amount of profit on each job as was earned last year. Required: 1. What is the markup on cost of goods sold (COGS) that will maintain the same profit as last year? (Round the percentage to two significant digits.) 2. A customer orders draperies and shades for a remodeling job. The job will have the following costs: What is the price that Ventana will quote given the markup percentage calculated in Requirement 1? (Round the price to the nearest dollar.) 3. What if Ventana wants to calculate a markup on direct materials cost, since it is the largest cost of doing business? What is the markup on direct materials cost that will maintain the same profit as last year? (Round the percentage to two significant digits.) What is the bid price Ventana will use for the job given in Requirement 2 if the markup percentage is calculated on the basis of direct materials cost? (Round to the nearest dollar.)arrow_forward
arrow_back_ios
SEE MORE QUESTIONS
arrow_forward_ios
Recommended textbooks for you
- Financial And Managerial AccountingAccountingISBN:9781337902663Author:WARREN, Carl S.Publisher:Cengage Learning,
 Managerial AccountingAccountingISBN:9781337912020Author:Carl Warren, Ph.d. Cma William B. TaylerPublisher:South-Western College Pub
 Cornerstones of Cost Management (Cornerstones Ser...AccountingISBN:9781305970663Author:Don R. Hansen, Maryanne M. MowenPublisher:Cengage Learning
  Excel Applications for Accounting PrinciplesAccountingISBN:9781111581565Author:Gaylord N. SmithPublisher:Cengage Learning
 Principles of Accounting Volume 2AccountingISBN:9781947172609Author:OpenStaxPublisher:OpenStax College
 Managerial Accounting: The Cornerstone of Busines...AccountingISBN:9781337115773Author:Maryanne M. Mowen, Don R. Hansen, Dan L. HeitgerPublisher:Cengage Learning
Financial And Managerial Accounting
Accounting
ISBN:9781337902663
Author:WARREN, Carl S.
Publisher:Cengage Learning,
Managerial Accounting
Accounting
ISBN:9781337912020
Author:Carl Warren, Ph.d. Cma William B. Tayler
Publisher:South-Western College Pub
Cornerstones of Cost Management (Cornerstones Ser...
Accounting
ISBN:9781305970663
Author:Don R. Hansen, Maryanne M. Mowen
Publisher:Cengage Learning
Excel Applications for Accounting Principles
Accounting
ISBN:9781111581565
Author:Gaylord N. Smith
Publisher:Cengage Learning
Principles of Accounting Volume 2
Accounting
ISBN:9781947172609
Author:OpenStax
Publisher:OpenStax College
Managerial Accounting: The Cornerstone of Busines...
Accounting
ISBN:9781337115773
Author:Maryanne M. Mowen, Don R. Hansen, Dan L. Heitger
Publisher:Cengage Learning
Relevant Costing Explained; Author: Kaplan UK;https://www.youtube.com/watch?v=hnsh3hlJAkI;License: Standard Youtube License