
Concept explainers
Videos
To analyze:
The differences in the
Given:
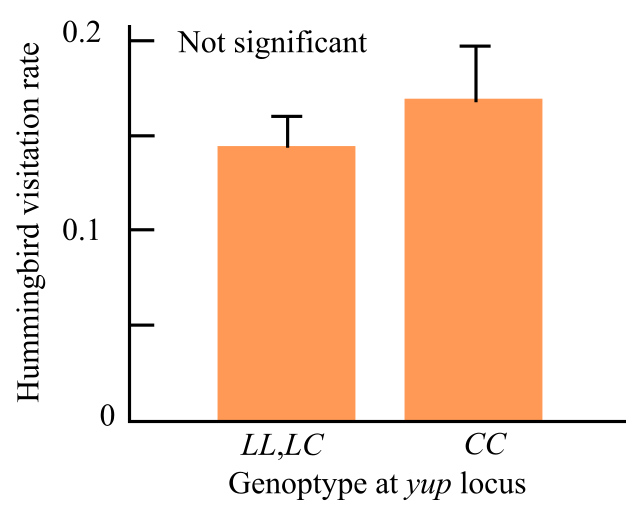
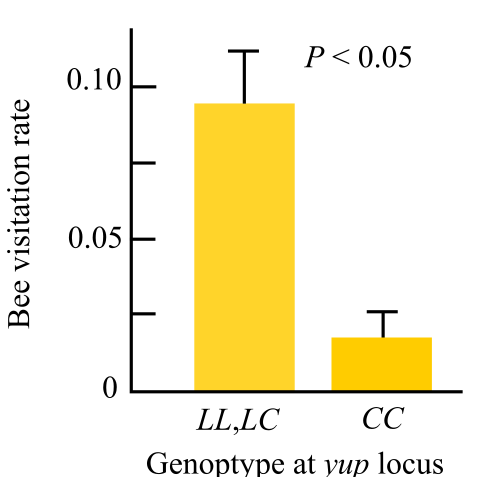
The variation at a single locus called the yup caused color differences in the two species, which was found by the researchers. The gene of M. cardinalis allele C is recessive, whereas the allele L of the M. lewisii is dominant.
The genotypes CC were found to be red, and the genotypes LC and LL were found to be light pink. The preference of the bees and hummingbirds were recorded. The graphs below show the visitation rates of the bees and hummingbirds.
Introduction:
Flower shows a variety of morphology having different color, structure, and texture. The morphology of flowers is decided by their genetic trait. Pollination plays an important role in the life cycle of the plant. It helps in fertilization of flowers. Pollination is carried out with the help of different insects, birds, and animals.

Trending nowThis is a popular solution!

Chapter 28 Solutions
Life: The Science of Biology


- Let’s suppose that pigmentation in a species of insect is controlled by a single gene existing in two alleles, D for dark and d for light. The heterozygote Dd is intermediate in color. In a heterogeneous environment, the allele frequencies are D = 0.7 and d = 0.3. This polymorphism is maintained because the environment has some dimly lit forested areas and some sunny fields. During a hurricane, a group of 1000 insects is blown to a completely sunny area. In this environment, the fitness values are DD = 0.3, Dd = 0.7, and dd = 1.0. Calculate the allele frequencies in the next generation.arrow_forwardI've observed varying egg mimic sizes on female fins: large, small, or none. I found that this trait follows Mendelian genetics with a single locus having two alleles: BB (large mimic), Bb (small mimic), and bb (no mimic). During a recent collection trip, we gathered 211 males with large egg mimics, 156 with small mimics, and 28 with no mimics. Is the locus in Hardy-Weinberg equilibrium, and what's the expected frequency of the small egg mimic phenotype in this population? 1.Yes it is in HW equilibrium, expected = 0.07 2.Yes it is in HW equilibrium, expected = 0.39 3.No it is not in HW equilibrium, expected = 0.53 4.No it is not in HW equilibrium, expected = 0.20 5.No it is not in HW equilibrium, expected = 1.0arrow_forwardn the savannahs of the Amazon different species of the genus Ipomoea are pollinated by either bumblebees or hummingbirds; lavender flowered I. marabaensis and red flowered I. cavalcantei. Which of the follwing data would support the suggestion of natural interspecific hybridization with weak postzygotic isolation? A. magenta flowered hybrids found in the wild were infertile and bidirectionally crossing with parental species B. magenta flowered hybrids found in the wild were preferentially pollinated by introduced honeybees rather than parental pollinators C. In the laboratory, offspring resulting from crosses between I. cavalcantei, I. marabaensis showed a mixture of parental floral characteristics D. In the laboratory, offspring resulting from crosses between I. cavalcantei, I. marabaensis and magenta flowered hybrid plants were autotropic and showed hybrid viabilityarrow_forward
- A naturalist visiting an island in the middle of a large lake observes a species of small bird with three distinct types of beaks. Those with short, crushing beaks (BB) consume hard-shelled nuts, those with long, delicate beaks (bb) pick the seeds from pinecones, and those with intermediate beaks (Bb), consume both types of seeds though they are not as good at either. Assume that this difference in beak morphology is the result of incomplete dominance in a single locus gene. Which of the mated pairs below will have the best adapted offspring in a year in which most of the food available is in the form of hard-shelled nuts? Show all work. Long delicate beak (bb) x short crushing beak (BB) Intermediate beak (Bb) x intermediate beak (Bb)arrow_forwardOne of the findings from Strickland et al. 2019, was that certain color morphs among Chelymorpha alternans beetles are more common at some field sites than they are at other sites. Strickland and colleagues used cross breeding experiments to investigate these patterns and found evidence that color variation was mainly due to Mendelian inheritance. In other species, geographic variation in coloration might not be due to Mendelian genetics. (a) What is another possible explanation for geographic variation in coloration? (b) What sort of experiment could you use to test this alternative explanation?arrow_forwardSkin colour in dolphins is determined by a single gene showingincomplete dominance giving rise to 3 phenotypes Brown, Pink &White. A survey of a large population of dolphins was carried outand the phenotypes recorded. However a student who had some.of the data stored on their phone fell overboard and unfortunatelythe data was lost. The only data saved was that the brownhomozygous dominants (BB) were 64% of the population.a) What would be the percentage of pink heterozygotes and whitehomozygotes?b) What percentage of the gametes that give rise to the nextgeneration of dolphins in this population will contain the b allele?arrow_forward
- A botanist studying water lilies in an isolated pond observedthree leaf shapes in the population: round, arrowhead, and scalloped.Marker analysis of DNA from 125 individuals showed theround-leaf plants to be homozygous for allele r1, while the plantswith arrowhead leaves were homozygous for a different allele atthe same locus, r2. Plants with scalloped leaves showed DNA profileswith both the r1 and r2 alleles. Frequency of the r1 allele wasestimated at 0.81. If the botanist counted 20 plants with scallopedleaves in the pond, what is the inbreeding coefficient F forthis population?arrow_forwardIn the fly speciation experiment described in class, Drosophila from a single culture was split into four isolated cultures, 2 raised on maltose food and two on starch food. After forty generations all possible crosses were done between maltose and starch flies and between the two starch populations. Flies from different food types had very low mating frequencies compared to flies from the same food type but flies from different starch populations only mated at a very slightly lower rate than flies from the same starch population. How would you interpret this finding?arrow_forwardIn the fly speciation experiment described in class, Drosophila from a single culture was split into four isolated cultures, 2 raised on maltose food and two on starch food. After forty generations all possible crosses were done between maltose and starch flies and between the two starch populations. Flies from different food types had very low mating frequencies compared to flies from the same food type but flies from different starch populations only mated at a very slightly lower rate than flies from the same starch population. How would you interpret this finding? Group of answer choices A. allopatric speciation is more powerful than sympatric speciation B. flies are incapable of evolution C. drift causes divergence more rapidly than selection D. sympatric speciation is more powerful than allopatric speciation E. selection causes divergence more rapidly than driftarrow_forward
- You conduct an RFLP analysis of head weight in one strain of cabbage;you determine that seven QTLs affect this trait. In anotherstrain of cabbage, you find that only four QTLs affect this trait.Note that both strains of cabbage are from the same species, althoughthey may have been subjected to different degrees of inbreeding.Explain how one strain can have seven QTLs andanother strain four QTLs for exactly the same trait. Is the secondstrain missing three genes?arrow_forwardDifferent species of crickets have distinct songs, andthey use these songs for mate recognition. Researcherscrossed two species of Hawaiian crickets (Laupala paranigra and L. kohalensis) whose songs are distinguishedby pulse rate (the number of pulses per second; Shaw etal., Molecular Ecology 16, 2007, 2879–2892.) Then, theymapped QTL in the F2 population derived from thiscross. Six autosomal QTL were detected. The mean traitvalues (pulses per second) at the three genotypic classesin the F2 for each QTL are shown in the table below,where P indicates the L. paranigra allele and K indicatesthe L. kohalensis allele.a. Calculate the additive (A) and dominance (D) effectsand the D/A ratio for each of the six QTL.b. Which of these QTL shows the greatest amount ofdominance?c. Which of these has the largest additive effect?d. The mean pulse rate for L. kohalensis is 3.72, and it is0.71 for L. paranigra. Do all six QTL act in the expecteddirection with the L. kohalensis allele conferring a…arrow_forwardImagine a locus with two alleles. Mutation at this locus changes one allele to the other (i.e. it does not create a new allele). If the rate of mutation from allele 1 to allele 2 is 0.00005 and the rate of mutation from allele 2 to allele 1 is 0.01, what is the equilibrium frequency of allele 2 (Give your answer to 5 decimal places)?arrow_forward
 Human Anatomy & Physiology (11th Edition)BiologyISBN:9780134580999Author:Elaine N. Marieb, Katja N. HoehnPublisher:PEARSON
 Biology 2eBiologyISBN:9781947172517Author:Matthew Douglas, Jung Choi, Mary Ann ClarkPublisher:OpenStax
 Anatomy & PhysiologyBiologyISBN:9781259398629Author:McKinley, Michael P., O'loughlin, Valerie Dean, Bidle, Theresa StouterPublisher:Mcgraw Hill Education,
 Molecular Biology of the Cell (Sixth Edition)BiologyISBN:9780815344322Author:Bruce Alberts, Alexander D. Johnson, Julian Lewis, David Morgan, Martin Raff, Keith Roberts, Peter WalterPublisher:W. W. Norton & Company
 Laboratory Manual For Human Anatomy & PhysiologyBiologyISBN:9781260159363Author:Martin, Terry R., Prentice-craver, CynthiaPublisher:McGraw-Hill Publishing Co.
 Inquiry Into Life (16th Edition)BiologyISBN:9781260231700Author:Sylvia S. Mader, Michael WindelspechtPublisher:McGraw Hill Education