
Essentials of Business Analytics (MindTap Course List)
2nd Edition
ISBN: 9781305627734
Author: Jeffrey D. Camm, James J. Cochran, Michael J. Fry, Jeffrey W. Ohlmann, David R. Anderson
Publisher: Cengage Learning
expand_more
expand_more
format_list_bulleted
Concept explainers
Videos
Textbook Question
Chapter 3, Problem 15P
An automotive company is considering the introduction of a new model of sports car that will be available in four-cylinder and six-cylinder engine types. A sample of customers who were interested in this new model were asked to indicate their preference for an engine type for the new model of automobile. The customers were also asked to indicate their preference for exterior color from four choices: red, black, green, and white. Consider the following data regarding the customer responses:
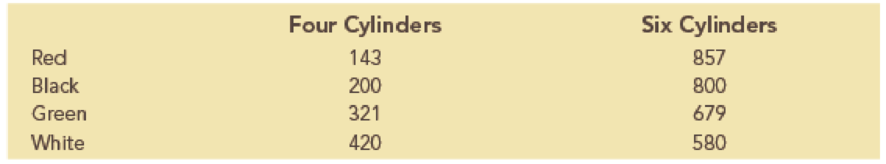
- a. Construct a clustered-column chart with exterior color as the horizontal variable.
- b. What can we infer from the clustered-bar chart in part a?
Expert Solution & Answer
Want to see the full answer?
Check out a sample textbook solution
Students have asked these similar questions
The Behavioral Risk Factor Surveillance System (BRFSS) is an annual telephone survey designed to identify risk factors in the adult population and reportemerging health trends. The following table summarizes two variables for the respondents: health status and health coverage, which describes whether each respondent had health insurance:
Health Status
Excellent
Very Good
Good
Fair
Poor
Total
Health
No
459
727
854
385
99
2524
Coverage
Yes
4198
6245
4821
1634
578
17476
Total
4657
6972
5675
2019
677
20000
If we draw one individual at random, what is the probability that the respondent has health coverage if they have good health?
Answer with a decimal rounded to 3 decimal places.
A cross-sectional study is conducted to investigate cardiovascular disease (CVD) risk factors among a sample of patients seeking medical care at one of three local hospitals. A total of 500500 patients are enrolled. Based on the following data, we would like to determine if there is a significant association between the family history of CVD and the enrollment site.
Enrollment Site
Family History of CVD
Hospital 1
Hospital 2
Hospital 3
Total
Yes
34
8
58
100
No
104
72
224
400
Total
138
80
282
500
Given:
The value of the test statistic is χ2= 6.912
Use α=0.1 as the level of significance.
The superintendent of Hospital 2 performed the Goodness of Fit Test to test whether 25% of the patients go to Hospital 1, 15% of the patients go to Hospital 2 and 60% of the patients go to Hospital 3.
Given: The superintendent found that the pp-value for the test is 0.25091
Let:
p1=p1= be the proportion of patients at Hospital 1
p2=p2= be the proportion of patients at…
An automotive company is considering the introduction of a new model of sports carthat will be available in two engine types: four cylinder and six cylinder. A sample ofcustomers who were interested in this new model were asked to indicate their preferencefor an engine type for the new model of automobile. The customers were also asked toindicate their preference for exterior color from four choices: red, black, green, and white.Consider the following data regarding the customer responses:
a. Construct a clustered column chart with exterior color as the horizontal variable.b. What can we infer from the clustered bar chart in part a?
Chapter 3 Solutions
Essentials of Business Analytics (MindTap Course List)
Ch. 3 - A sales manager is trying to determine appropriate...Ch. 3 - The following table shows an example of gross...Ch. 3 - The following table provides monthly revenue...Ch. 3 - In the file MajorSalary, data have been collected...Ch. 3 - Entrepreneur magazine ranks franchises. Among the...Ch. 3 - The file MutualFunds contains a data set with...Ch. 3 - The file TaxData contains information from federal...Ch. 3 - The file FDICBankFailures contains data on...Ch. 3 - The following 20 observations are for two...Ch. 3 - The file Fortune500 contains data for profits and...
Ch. 3 - The International Organization of Motor Vehicle...Ch. 3 - Prob. 12PCh. 3 - Prob. 13PCh. 3 - The total number of term life insurance contracts...Ch. 3 - An automotive company is considering the...Ch. 3 - Consider the following survey results regarding...Ch. 3 - The Northwest regional manager of Logan Outdoor...Ch. 3 - The Ajax Company uses a portfolio approach to...Ch. 3 - Heat maps can be very useful for identifying...Ch. 3 - The following table shows monthly revenue for six...Ch. 3 - Prob. 21PCh. 3 - Aurora Radiological Services is a health care...Ch. 3 - The motion picture industry is an extremely...
Knowledge Booster


Learn more about
Need a deep-dive on the concept behind this application? Look no further. Learn more about this topic, statistics and related others by exploring similar questions and additional content below.Similar questions
- A study identified Bridgeport, Connecticut, San Jose, California, Washington, D.C., and Lexington Park, Maryland as the four U.S. cities with the highest percentage of millionaires. The following data show the following number of millionaires for samples of individuals from each of the four cities. Millionaire City Bridgeport, CT San Jose, CA Washington, D.C. Lexington Park, MD Yes 47 38 39 37 No 453 262 361 363 (1) What is the estimate of the percentage of millionaires in each of these cities? (Round your answers to two decimal places.) Bridgeport, CT ______ % San Jose, CA _______% Washington, D.C. _______% Lexington Park, __________MD % (2) Using a 0.05 level of significance, test for the equality of the population proportion of millionaires for these four cities. State the null and alternative hypotheses. A) H0: At least two of the population proportions are equal. Ha: None of the population proportions are equal. B) H0: Not all population proportions are equal.…arrow_forwardLaveist and Nuru-Jeter (A-4) conducted a study to determine if doctor–patient race concordance was associated with greater satisfaction with care. Toward that end, they collected a national sample of African-American, Caucasian, Hispanic, and Asian-American respondents. The following table classifies the race of the subjects as well as the race of their physician: Patient’s Race African- Physician’s Race Caucasian American Hispanic Asian- American Total White 779 436African-American 14 162 15 5 196 Hispanic 19 17 128 2 166 Asian=Pacific-Islander 68 75 71 203 417 Other 3055564145 Total 910 745 676 389 2720 Source: Thomas A. Laveist and Amani Nuru-Jeter, “Is Doctor–Patient Race Concordance Associated with Greater Satisfaction with Care?” Journal of Health and Social Behavior, 43 (2002), 296–306.(a) What is the probability that a randomly selected subject will have an Asian=Pacific-Islander physician? (b) What is the probability that an African-American subject will have an…arrow_forwardLaveist and Nuru-Jeter (A-4) conducted a study to determine if doctor–patient race concordance was associated with greater satisfaction with care. Toward that end, they collected a national sample of African-American, Caucasian, Hispanic, and Asian-American respondents. The following table classifies the race of the subjects as well as the race of their physician: Patient’s Race African- Physician’s Race Caucasian American Hispanic Asian- American Total White 779 436African-American 14 162 15 5 196 Hispanic 19 17 128 2 166 Asian=Pacific-Islander 68 75 71 203 417 Other 3055564145 Total 910 745 676 389 2720 Source: Thomas A. Laveist and Amani Nuru-Jeter, “Is Doctor–Patient Race Concordance Associated with Greater Satisfaction with Care?” Journal of Health and Social Behavior, 43 (2002), 296–306. (d) What is the probability that a subject chosen at random will be Hispanic or have a Hispanic physician? (e) Use the concept of complementary events to find the probability that…arrow_forward
arrow_back_ios
arrow_forward_ios
Recommended textbooks for you
 Glencoe Algebra 1, Student Edition, 9780079039897...AlgebraISBN:9780079039897Author:CarterPublisher:McGraw Hill
Glencoe Algebra 1, Student Edition, 9780079039897...
Algebra
ISBN:9780079039897
Author:Carter
Publisher:McGraw Hill
Probability & Statistics (28 of 62) Basic Definitions and Symbols Summarized; Author: Michel van Biezen;https://www.youtube.com/watch?v=21V9WBJLAL8;License: Standard YouTube License, CC-BY
Introduction to Probability, Basic Overview - Sample Space, & Tree Diagrams; Author: The Organic Chemistry Tutor;https://www.youtube.com/watch?v=SkidyDQuupA;License: Standard YouTube License, CC-BY