
Essentials of Business Analytics (MindTap Course List)
2nd Edition
ISBN: 9781305627734
Author: Jeffrey D. Camm, James J. Cochran, Michael J. Fry, Jeffrey W. Ohlmann, David R. Anderson
Publisher: Cengage Learning
expand_more
expand_more
format_list_bulleted
Concept explainers
Videos
Textbook Question
Chapter 3, Problem 2P
The following table shows an example of gross domestic product values for five countries over six years in equivalent U.S. dollars ($).
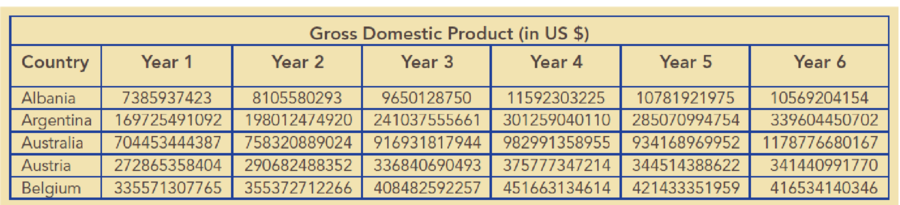
- a. How could you improve the readability of this table?
- b. The file GDPyears contains sample data from the United Nations Statistics Division on 30 countries and their GDP values from Year 1 to Year 6 in US$. Create a table that provides all these data for a user. Format the table to make it as easy to read as possible.
Hint: It is generally not important for the user to know GDP to an exact dollar figure. It is typical to present GDP values in millions or billions of dollars.
Expert Solution & Answer

Trending nowThis is a popular solution!

Chapter 3 Solutions
Essentials of Business Analytics (MindTap Course List)
Ch. 3 - A sales manager is trying to determine appropriate...Ch. 3 - The following table shows an example of gross...Ch. 3 - The following table provides monthly revenue...Ch. 3 - In the file MajorSalary, data have been collected...Ch. 3 - Entrepreneur magazine ranks franchises. Among the...Ch. 3 - The file MutualFunds contains a data set with...Ch. 3 - The file TaxData contains information from federal...Ch. 3 - The file FDICBankFailures contains data on...Ch. 3 - The following 20 observations are for two...Ch. 3 - The file Fortune500 contains data for profits and...
Ch. 3 - The International Organization of Motor Vehicle...Ch. 3 - Prob. 12PCh. 3 - Prob. 13PCh. 3 - The total number of term life insurance contracts...Ch. 3 - An automotive company is considering the...Ch. 3 - Consider the following survey results regarding...Ch. 3 - The Northwest regional manager of Logan Outdoor...Ch. 3 - The Ajax Company uses a portfolio approach to...Ch. 3 - Heat maps can be very useful for identifying...Ch. 3 - The following table shows monthly revenue for six...Ch. 3 - Prob. 21PCh. 3 - Aurora Radiological Services is a health care...Ch. 3 - The motion picture industry is an extremely...
Knowledge Booster


Learn more about
Need a deep-dive on the concept behind this application? Look no further. Learn more about this topic, statistics and related others by exploring similar questions and additional content below.Recommended textbooks for you
 Glencoe Algebra 1, Student Edition, 9780079039897...AlgebraISBN:9780079039897Author:CarterPublisher:McGraw Hill
Glencoe Algebra 1, Student Edition, 9780079039897...
Algebra
ISBN:9780079039897
Author:Carter
Publisher:McGraw Hill
Sequences and Series Introduction; Author: Mario's Math Tutoring;https://www.youtube.com/watch?v=m5Yn4BdpOV0;License: Standard YouTube License, CC-BY
Introduction to sequences; Author: Dr. Trefor Bazett;https://www.youtube.com/watch?v=VG9ft4_dK24;License: Standard YouTube License, CC-BY