
Essentials of Business Analytics (MindTap Course List)
2nd Edition
ISBN: 9781305627734
Author: Jeffrey D. Camm, James J. Cochran, Michael J. Fry, Jeffrey W. Ohlmann, David R. Anderson
Publisher: Cengage Learning
expand_more
expand_more
format_list_bulleted
Videos
Textbook Question
Chapter 3, Problem 11P
The International Organization of Motor Vehicle Manufacturers (officially known as the Organisation Internationale des Constructeurs d’Automobiles, OICA) provides data on worldwide vehicle production by manufacturer. The following table shows vehicle production numbers for four different manufacturers for five recent years. Data are in millions of vehicles.
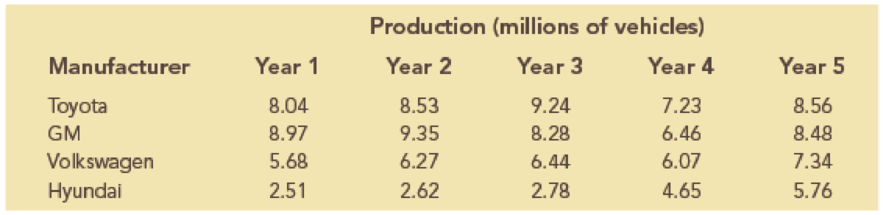
- a. Construct a line chart for the time series data for years 1 through 5 showing the number of vehicles manufactured by each automotive company. Show the time series for all four manufacturers on the same graph.
- b. What does the line chart indicate about vehicle production amounts from years 1 through 5? Discuss.
- c. Construct a clustered-bar chart showing vehicles produced by automobile manufacturer using the year 1 through 5 data. Represent the years of production along the horizontal axis, and cluster the production amounts for the four manufacturers in each year. Which company is the leading manufacturer in each year?
Expert Solution & Answer
Want to see the full answer?
Check out a sample textbook solution
Students have asked these similar questions
The following data show the number of rental cars in service for three rental car corporations: Henz, Avis and Dollar. The data are for the years 2007-2010 and are in thousands of vehicles (auto Rental News website, May 15, 2011)
Company
2007
2008
2009
2010
Hentz
327
311
286
290
Dollar
167
140
106
108
Avis
204
220
300
270
Construct a time series graph for years 2007 and 2010 showing the number of rental cars service for each company. Show the time series for all three companies on the same graph
Comment on who appears to be the market share leaders and how market shares are changing over time.
Construct a bar chart showing rental cars in service for 2010. Is this chart based on cross sectional or time series data?
the values of alabama building contracts (in $ millions) for a 12-month period follow.240 350 230 260 280 320 220 310 240 310 240 230a. construct a time series plot. What type of pattern exists in the data?
The Energy Information Administration of the U.S. Department of Energy providedtime series data for the U.S. average price per gallon of conventional regular gasolinebetween January 2007 and February 2014 (Energy Information Administration website,March 2014). Use the Internet to obtain the average price per gallon of conventionalregular gasoline since February 2014.a. Extend the graph of the time series shown in Figure 1.1.b. What interpretations can you make about the average price per gallon of conventionalregular gasoline since February 2014?c. Does the time series continue to show a summer increase in the average price pergallon? Explain.
Chapter 3 Solutions
Essentials of Business Analytics (MindTap Course List)
Ch. 3 - A sales manager is trying to determine appropriate...Ch. 3 - The following table shows an example of gross...Ch. 3 - The following table provides monthly revenue...Ch. 3 - In the file MajorSalary, data have been collected...Ch. 3 - Entrepreneur magazine ranks franchises. Among the...Ch. 3 - The file MutualFunds contains a data set with...Ch. 3 - The file TaxData contains information from federal...Ch. 3 - The file FDICBankFailures contains data on...Ch. 3 - The following 20 observations are for two...Ch. 3 - The file Fortune500 contains data for profits and...
Ch. 3 - The International Organization of Motor Vehicle...Ch. 3 - Prob. 12PCh. 3 - Prob. 13PCh. 3 - The total number of term life insurance contracts...Ch. 3 - An automotive company is considering the...Ch. 3 - Consider the following survey results regarding...Ch. 3 - The Northwest regional manager of Logan Outdoor...Ch. 3 - The Ajax Company uses a portfolio approach to...Ch. 3 - Heat maps can be very useful for identifying...Ch. 3 - The following table shows monthly revenue for six...Ch. 3 - Prob. 21PCh. 3 - Aurora Radiological Services is a health care...Ch. 3 - The motion picture industry is an extremely...
Knowledge Booster


Learn more about
Need a deep-dive on the concept behind this application? Look no further. Learn more about this topic, statistics and related others by exploring similar questions and additional content below.Similar questions
- The following data set provides the total number of shipments of core major household appliances in the U.S. from 2000 to 2016 (in millions): Year Shipments (millions) 2000 38.4 2001 38.2 2002 40.8 2003 42.5 2004 46.1 2005 47.0 2006 46.7 2007 44.1 2008 39.8 2009 36.5 2010 38.2 2011 36.0 2012 35.8 2013 39.2 2014 41.5 2015 42.9 2016 44.7 a. Plot the time series. b. Fit a three-year moving average to the data and plot the results. c. Fit a five-year moving average to the data and plot the results. d. Compute a linear trend forecasting equation and plot the trend line. e. Compute a quadratic trend forecasting equation and plot the results.arrow_forwardSuppose the following table shows the approximate price of a certain stock in December of each year from 2005 through 2014, as well as the 4-year moving averages for 2005 through 2007.† Complete the table by computing the remaining 4-year moving averages. (Note the peak in 2007 and the drop in subsequent years.) Round each average to the nearest dollar. (Chart in picture)arrow_forwardAnalyse the time series of the following supermarket sales data and present the results in graphical form, including a forecast for the daily sales in week 5. Supermarket sales (K000) for a particular period Week 1 Week 2 Week 3 Week 4 Monday 22 22 24 26 Tuesday 36 34 38 38 Wednesday 40 42 43 45 Thursday 48 49 49 50 Friday 61 58 62 64 Saturday 58 59 58 58arrow_forward
- Suppose the following table shows the approximate price of a certain stock in December of each year from 2005 through 2014, as well as the 4-year moving averages for 2005 through 2007.† Complete the table by computing the remaining 4-year moving averages. (Note the peak in 2007 and the drop in subsequent years.) Round each average to the nearest dollar.arrow_forwarda. Compute a weighted 3-month moving average forecast for months 4 through 9. Assign weights 5,3, and 1 to the months in sequence starting with the most recent month. Show your complete and step by step solution and answer.arrow_forwardRespond to each of the items using the following time series data. Period Demand 1 104 2 132 3 117 4 120 5 104 6 141 7 120 8 136 9 109 10 143 11 142 12 109 13 113 14 124 15 113 16 107arrow_forward
arrow_back_ios
arrow_forward_ios
Recommended textbooks for you
 MATLAB: An Introduction with ApplicationsStatisticsISBN:9781119256830Author:Amos GilatPublisher:John Wiley & Sons Inc
 Probability and Statistics for Engineering and th...StatisticsISBN:9781305251809Author:Jay L. DevorePublisher:Cengage Learning
 Statistics for The Behavioral Sciences (MindTap C...StatisticsISBN:9781305504912Author:Frederick J Gravetter, Larry B. WallnauPublisher:Cengage Learning
 Elementary Statistics: Picturing the World (7th E...StatisticsISBN:9780134683416Author:Ron Larson, Betsy FarberPublisher:PEARSON
 The Basic Practice of StatisticsStatisticsISBN:9781319042578Author:David S. Moore, William I. Notz, Michael A. FlignerPublisher:W. H. Freeman
 Introduction to the Practice of StatisticsStatisticsISBN:9781319013387Author:David S. Moore, George P. McCabe, Bruce A. CraigPublisher:W. H. Freeman
MATLAB: An Introduction with Applications
Statistics
ISBN:9781119256830
Author:Amos Gilat
Publisher:John Wiley & Sons Inc
Probability and Statistics for Engineering and th...
Statistics
ISBN:9781305251809
Author:Jay L. Devore
Publisher:Cengage Learning
Statistics for The Behavioral Sciences (MindTap C...
Statistics
ISBN:9781305504912
Author:Frederick J Gravetter, Larry B. Wallnau
Publisher:Cengage Learning
Elementary Statistics: Picturing the World (7th E...
Statistics
ISBN:9780134683416
Author:Ron Larson, Betsy Farber
Publisher:PEARSON
The Basic Practice of Statistics
Statistics
ISBN:9781319042578
Author:David S. Moore, William I. Notz, Michael A. Fligner
Publisher:W. H. Freeman
Introduction to the Practice of Statistics
Statistics
ISBN:9781319013387
Author:David S. Moore, George P. McCabe, Bruce A. Craig
Publisher:W. H. Freeman
Finite Math: Markov Chain Example - The Gambler's Ruin; Author: Brandon Foltz;https://www.youtube.com/watch?v=afIhgiHVnj0;License: Standard YouTube License, CC-BY
Introduction: MARKOV PROCESS And MARKOV CHAINS // Short Lecture // Linear Algebra; Author: AfterMath;https://www.youtube.com/watch?v=qK-PUTuUSpw;License: Standard Youtube License
Stochastic process and Markov Chain Model | Transition Probability Matrix (TPM); Author: Dr. Harish Garg;https://www.youtube.com/watch?v=sb4jo4P4ZLI;License: Standard YouTube License, CC-BY