
Essentials of Business Analytics (MindTap Course List)
2nd Edition
ISBN: 9781305627734
Author: Jeffrey D. Camm, James J. Cochran, Michael J. Fry, Jeffrey W. Ohlmann, David R. Anderson
Publisher: Cengage Learning
expand_more
expand_more
format_list_bulleted
Concept explainers
Videos
Textbook Question
Chapter 3, Problem 5P
Entrepreneur magazine ranks franchises. Among the factors that the magazine uses in its rankings are growth rate, number of locations, start-up costs, and financial stability. A recent ranking listed the top 20 U.S. franchises and the number of locations as follows:
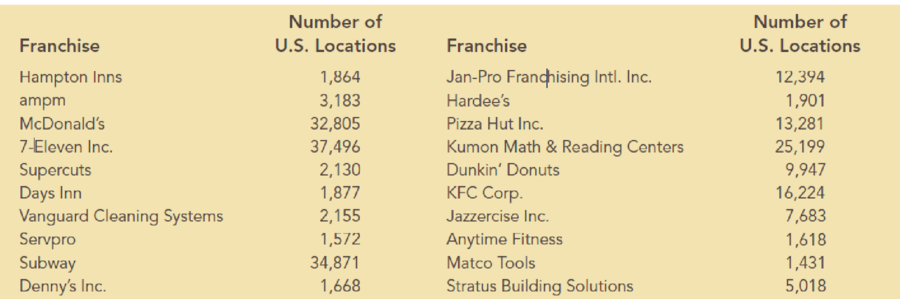
These data can be found in the file Franchises. Create a PivotTable to summarize these data using classes 0–9,999, 10,000–19,999, 20,000–29,999, 30,000–39,999 to answer the following questions. (Hint: Use Number of U.S. Locations as the COLUMNS, and use Count of Number of U.S. Locations as the VALUES in the PivotTable.)
- a. How many franchises have between 0 and 9,999 locations?
- b. How many franchises have more than 30,000 locations?
Expert Solution & Answer

Trending nowThis is a popular solution!

Students have asked these similar questions
How will marketers change their social media use in the near future? A survey by Social Media Examiner reported that 77% of B2B marketers (marketers that focus primarily on attracting businesses) plan to increase their use of LinkedIn, as compared to 54% of B2C marketers (marketers that primarily target consumers). The survey was based on 1,184 B2B marketers and 1,703 B2C marketers. The following table summarizes the results:
Give an example of a simple
Give an example of a joint
What is the complement of a marketer who plans to increase use of LinkedIn?
Why is a marketer who plans to increase use of LinkedIn and is a B2C marketer a joint event?
The Minister of National Security in Trinidad and Tobago is interested in determining the factors that influence the number of crimes that are reported. You are tasked to develop a model using the appropriate variables. The following variables are utilized:
X1
X2
X3
X4
X5
X6
478
184
74
11
31
20
494
213
72
11
43
18
643
347
70
18
16
16
341
565
71
11
25
19
773
327
72
9
29
24
603
260
68
8
32
15
484
325
68
12
24
14
546
102
62
13
28
11
424
38
69
7
25
12
548
226
66
9
58
15
506
137
60
13
21
9
819
369
81
4
77
36
541
109
66
9
37
12
491
809
67
11
37
16
514
29
65
12
35
11
371
245
64
10
42
14
457
118
64
12
21
10
437
148
62
7
81
27
570
387
59
15
31
16
432
98
56
15
50
15
619
608
46
22
24
8
357…
Define A Competitive-Hunter Model ?
Chapter 3 Solutions
Essentials of Business Analytics (MindTap Course List)
Ch. 3 - A sales manager is trying to determine appropriate...Ch. 3 - The following table shows an example of gross...Ch. 3 - The following table provides monthly revenue...Ch. 3 - In the file MajorSalary, data have been collected...Ch. 3 - Entrepreneur magazine ranks franchises. Among the...Ch. 3 - The file MutualFunds contains a data set with...Ch. 3 - The file TaxData contains information from federal...Ch. 3 - The file FDICBankFailures contains data on...Ch. 3 - The following 20 observations are for two...Ch. 3 - The file Fortune500 contains data for profits and...
Ch. 3 - The International Organization of Motor Vehicle...Ch. 3 - Prob. 12PCh. 3 - Prob. 13PCh. 3 - The total number of term life insurance contracts...Ch. 3 - An automotive company is considering the...Ch. 3 - Consider the following survey results regarding...Ch. 3 - The Northwest regional manager of Logan Outdoor...Ch. 3 - The Ajax Company uses a portfolio approach to...Ch. 3 - Heat maps can be very useful for identifying...Ch. 3 - The following table shows monthly revenue for six...Ch. 3 - Prob. 21PCh. 3 - Aurora Radiological Services is a health care...Ch. 3 - The motion picture industry is an extremely...
Knowledge Booster


Learn more about
Need a deep-dive on the concept behind this application? Look no further. Learn more about this topic, statistics and related others by exploring similar questions and additional content below.Similar questions
- Set up a spreadsheet simulation model in which whether Atlanta wins each game is arandom variable.arrow_forwardFor the data in the following matrix: No Treatment Treatment Male 8 3 Overall M = 5.5 Female 4 4 Overall M = 4 Overall M = 6 Overall M = 3.5 Which two means are compared to determine whether there is a main effect of treatment? Is there a treatment by gender interaction? Do the effects of treatment on the scores depend on the levels of gender( do the effects of treatment on the scores are different in males and females? If so, explain the interaction, include the corresponding means in your explanation.arrow_forwardShould large retailers offer banking services? Small community banks may be concerned about their future if more retailers enter the world of banking. Suppose that a market research company conducted a national survey for one retailer that is considering offering banking services to its customers. The respondents were asked to indicate the provider (bank, retail store, other) that they most likely would use for certain banking services (assuming that rate is not a factor). Is there a relationship between these two variables? Provider Service Bank Retail Store Other Checking account Savings account Home mortgage 100 85 30 45 25 10 10 45 80arrow_forward
- Meagan Dubean manages a portfolio of 200 common stocks. Her staff classified the portfolio stocks by 'industry sector' and 'investment objective.' InvestmentObjective Industry Sector Electronics Airlines Healthcare Total Growth 100 10 40 150 Income 20 20 10 50 Total 120 30 50 200 If a stock is selected randomly from Meagan's portfolio, P (Healthcare∪Electronics) = _______. 0.85 0.60 0.90 0.25 0.75arrow_forwardhow has Covid-19 impacted organizational behavior?arrow_forwardAn auctioneer of antique Iranian rugs kept records of his weekly auctions in order to determine the relationships among price, age of carpet or rug, number of people attending the auction, and the number of times the winning bidder had previously attended his auctions. He felt that, with this information, he could plan his auctions better, serve his steady customers better, and make a higher overall profit for himself.arrow_forward
- For the data in the following matrix No treatment Treatment Female 8 14 11 Male 4 10 7 6 12 A) Which two means are compared to describe the treatment main effect? B) Which two means are compared to describe the gender main effect? C) Is there an interaction between gender and treatment? Explain your answer.arrow_forwardMeagan Dubean manages a portfolio of 200 common stocks. Her staff classified the portfolio stocks by 'industry sector' and 'investment objective.' InvestmentObjective Industry Sector Electronics Airlines Healthcare Total Growth 100 10 40 150 Income 20 20 10 50 Total 120 30 50 200 If a stock is selected randomly from Meagan's portfolio, P (Growth) = _______. 0.75 0.67 0.83 0.90 0.50arrow_forwardA researcher is testing whether patients benefit differently from psychoanalytic vs. behavioral-cognitive vs. humanistic psychotherapy. Which of the following is the name of the design of this study? 2 x 3 design 2 x 2 design One way design 3 x 3 designarrow_forward
- The table below contains the total cost ($) for four tickets to a basketball game purchased on the secondary market, two beers, two soft drinks, two hot dogs, and one parking space at each arena during a recent season. 215.02 224.58 224.43 215.97 203.04 287.43 261.25 214.76 395.96 317.13 301.05 370.49 310.61 319.41 319.33 420.73 420.32 481.66 484.87 430.76 411.28 543.08 566.08 535.56 532.38 619.08 727.78 766.28 791.92 897.06 a. Organize these costs as an ordered array. b. Construct a frequency distribution and a percentage distribution for these costs. c. Around what values, if any, are at least 75% of the costs of attending the game concentrated? Explain. At least 75% of the costs of attending a game are concentrated around the class groupings "$200 but less than $400" and "$500 but less than $700." B. At least 75% of…arrow_forwardcan anyone please explain the solution in part (B)? why does he multiply 2024 sales by (11), 2025 by (12), and 2025 by (13)? why he used 11,12,13 specifically to perform the forcasting for each year? I provided the data that were used in the question in case you need itarrow_forwardThe file MidCity Download MidCitycontains data on 128 recent sales in Mid City. For each sale, the file shows the neighborhood (1, 2, or 3) in which the house is located, the number of offers made on the house, the square footage, whether the house is made primarily of brick, the number of bathrooms, the number of bedrooms, and the selling price. Neighborhoods 1 and 2 are more traditional neighborhoods, whereas neighborhood 3 is a newer, more prestigious neighborhood. PROBLEM 1: Construct 3 different confidence intervals. Part A) Sort and filter the data from the MidCity file so that you only consider the data from neighborhood 1. Construct a 99% confidence interval for the square footage of all homes in neighborhood 1. Make sure you list the specific equations you are using, ALL variables, show ALL work etc., in your report. You can use Excel to complete all computations. Remember to interpret these confidence intervals in the context of this problem. Use one Excel spreadsheet…arrow_forward
arrow_back_ios
SEE MORE QUESTIONS
arrow_forward_ios
Recommended textbooks for you
 MATLAB: An Introduction with ApplicationsStatisticsISBN:9781119256830Author:Amos GilatPublisher:John Wiley & Sons Inc
 Probability and Statistics for Engineering and th...StatisticsISBN:9781305251809Author:Jay L. DevorePublisher:Cengage Learning
 Statistics for The Behavioral Sciences (MindTap C...StatisticsISBN:9781305504912Author:Frederick J Gravetter, Larry B. WallnauPublisher:Cengage Learning
 Elementary Statistics: Picturing the World (7th E...StatisticsISBN:9780134683416Author:Ron Larson, Betsy FarberPublisher:PEARSON
 The Basic Practice of StatisticsStatisticsISBN:9781319042578Author:David S. Moore, William I. Notz, Michael A. FlignerPublisher:W. H. Freeman
 Introduction to the Practice of StatisticsStatisticsISBN:9781319013387Author:David S. Moore, George P. McCabe, Bruce A. CraigPublisher:W. H. Freeman
MATLAB: An Introduction with Applications
Statistics
ISBN:9781119256830
Author:Amos Gilat
Publisher:John Wiley & Sons Inc
Probability and Statistics for Engineering and th...
Statistics
ISBN:9781305251809
Author:Jay L. Devore
Publisher:Cengage Learning
Statistics for The Behavioral Sciences (MindTap C...
Statistics
ISBN:9781305504912
Author:Frederick J Gravetter, Larry B. Wallnau
Publisher:Cengage Learning
Elementary Statistics: Picturing the World (7th E...
Statistics
ISBN:9780134683416
Author:Ron Larson, Betsy Farber
Publisher:PEARSON
The Basic Practice of Statistics
Statistics
ISBN:9781319042578
Author:David S. Moore, William I. Notz, Michael A. Fligner
Publisher:W. H. Freeman
Introduction to the Practice of Statistics
Statistics
ISBN:9781319013387
Author:David S. Moore, George P. McCabe, Bruce A. Craig
Publisher:W. H. Freeman
Sampling Methods and Bias with Surveys: Crash Course Statistics #10; Author: CrashCourse;https://www.youtube.com/watch?v=Rf-fIpB4D50;License: Standard YouTube License, CC-BY
Statistics: Sampling Methods; Author: Mathispower4u;https://www.youtube.com/watch?v=s6ApdTvgvOs;License: Standard YouTube License, CC-BY