EBK MATERIALS FOR CIVIL AND CONSTRUCTIO
4th Edition
ISBN: 8220102719569
Author: ZANIEWSKI
Publisher: PEARSON
expand_more
expand_more
format_list_bulleted
Videos
Textbook Question
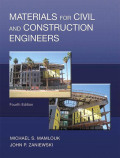
Chapter 3, Problem 3.35QP
A high-yield-strength alloy steel bar with a rectangular cross section that has a width of 37.5 mm, a thickness of 6.25 mm, and a gauge length of 203 mm was tested in tension to rupture, according to ASTM E-8 method. The load and deformation data were as shown in Table P3.35.
Using a spreadsheet program, obtain the following:
- a. A plot of the stress-strain relationship. Label the axes and show units.
- b. A plot of the linear portion of the stress-strain relationship, Determine modulus of elasticity using the best-fit approach.
- c. Proportional limit.
- d. Yield stress.
- e. Ultimate strength.
- f. If the specimen is loaded to 155 kN only and then unloaded, what is the permanent deformation?
- g. In designing a typical structure made of this material, wronld you expect the stress applied in (f) safe? Why?
TABLE P3.35
Expert Solution & Answer
Want to see the full answer?
Check out a sample textbook solution
Students have asked these similar questions
A 19-mm reinforcing steel bar and a gauge length of 75 mm was subjected to ten-
sion, with the results shown in Table P3.27. Using a computer spreadsheet pro-
gram, plot the stress-strain relationship. From the graph, determine the Young's
modulus of the steel and the deformation corresponding to a 150-kN load.
TABLE P3.27
Load, kN
Deformation, mm
54
0.084
163
0.168
284
0.336
330
1.428
366
3.360
Three steel bars have a diameter of 25 mm and carbon contents of 0.2, 0.5,
and 0.8%, respectively. The specimens were subjected to tension until rup-
ture. The load versus deformation results were as shown in Table P3.19.
If the gauge length is 50 mm, determine the following:
a. The tensile stresses and strains for each specimen at each load increment.
b. Plot stresses versus strains for all specimens on one graph.
TABLE P3.19
Specimen No.
Carbon Content (%)
Deformation (mm)
1
2
3
0.2
0.5
0.8
Load (kN)
0.00
0.07
133
133
133
0.10
137
191
191
0.15
142
196
285
0.50
147
201
324
1.00
140
199
383
2,50
155
236
447
5.00
196
295
491 (Rupture)
7.50
226
336
10.00
241
341
12.50
218
304 (Rupture)
13.75
196 (Rupture)
c. The proportional limit for each specimen.
d. The 0.2% offset yield strength for each specimen.
e. The modulus of elasticity for each specimen.
f. The strain at rupture for each specimen.
g. Comment on the effect of increasing the carbon content on the following:
i. Yield strength
ii.…
A high-yield-strength alloy steel bar with a rectangular cross section that has a width of 37.5 mm, a thickness of 6.25 mm, and a gauge length of 203 mm was tested in tension to rupture, according to ASTM E-8 method. The load and deformation data were as shown in Table Using a spreadsheet program, obtain the following:a. A plot of the stress–strain relationship. Label the axes and show units.b. A plot of the linear portion of the stress–strain relationship. Determine modulus of elasticity using the best-fit approach.c. Proportional limit.d. Yield stress.e. Ultimate strength.f. If the specimen is loaded to 155 kN only and then unloaded, what is the permanent deformation?g. In designing a typical structure made of this material, would you expect the stress applied in (f) safe? Why?
Chapter 3 Solutions
EBK MATERIALS FOR CIVIL AND CONSTRUCTIO
Ch. 3 - What is the chemical composition of steel? What is...Ch. 3 - Why does the ironcarbon phase diagram go only to...Ch. 3 - Draw a simple ironcarbon phase diagram showing the...Ch. 3 - What is the typical maximum percent of carbon in...Ch. 3 - Calculate the amounts and compositions of phases...Ch. 3 - Briefly discuss four heat treatment methods to...Ch. 3 - Define alloy steels. Explain why alloys are added...Ch. 3 - Prob. 3.8QPCh. 3 - Specifically state the shape and size of the...Ch. 3 - What are the typical uses of structural steel?
Ch. 3 - What is the range of thicknesses of cold-formed...Ch. 3 - Why is coil steel used for cold-formed steel...Ch. 3 - If a steel with a 33 ksi yield strength is used...Ch. 3 - Why is reinforcing steel used in concrete? Discuss...Ch. 3 - What is high-performance steel? State two HPS...Ch. 3 - Name three mechanical tests used to measure...Ch. 3 - The following laboratory tests are performed on...Ch. 3 - Sketch the stress-strain behavior of steel, and...Ch. 3 - Three steel bars with a diameter of 25 mm and...Ch. 3 - Three steel bars with a diameter of 0.5 in. and...Ch. 3 - Draw a typical stressstrain relationship for steel...Ch. 3 - Getting measurements from Figure 3.18, determine...Ch. 3 - A steel specimen is tested in tension. The...Ch. 3 - A steel specimen is tested in tension. The...Ch. 3 - A No. 10 steel rebar is tested in tension. By...Ch. 3 - A mild steel specimen originally 300 mm long is...Ch. 3 - A tension stress of 70 ksi was applied on a 12-in....Ch. 3 - A tensile stress is applied along the long axis of...Ch. 3 - A cylindrical steel alloy rod with a 0.5 in....Ch. 3 - A round steel alloy bar with a diameter of 0.75...Ch. 3 - A 19-mm reinforcing steel bar and a gauge length...Ch. 3 - Testing a round steel alloy bar with a diameter of...Ch. 3 - During the tension test on a steel rod within the...Ch. 3 - A grade 36 round steel bar with a diameter of 0.5...Ch. 3 - A high-yield-strength alloy steel bar with a...Ch. 3 - Estimate the cross-sectional area of a 350S125-27...Ch. 3 - An ASTM A615 grade 60 number 10 rebar with a gauge...Ch. 3 - A 32-mm rebar with a gauge length of 200 mm was...Ch. 3 - A steel pipe having a length of 3 ft. an outside...Ch. 3 - A steel pipe having a length of 1 m, an outside...Ch. 3 - A drill rod with a diameter of 10 mm is made of...Ch. 3 - A drill rod with, a diameter of 1/2 in. is made of...Ch. 3 - Prob. 3.43QPCh. 3 - An engineering technician performed a tension test...Ch. 3 - A Charpy V Notch (CVN) test was performed on a...Ch. 3 - Prob. 3.46QPCh. 3 - Prob. 3.47QPCh. 3 - How can the flaws in steel and welds be detected?...Ch. 3 - Determine the welding zone classification of A36...Ch. 3 - Briefly define steel corrosion. What are the four...Ch. 3 - Discuss the main methods used to protect steel...
Knowledge Booster


Learn more about
Need a deep-dive on the concept behind this application? Look no further. Learn more about this topic, civil-engineering and related others by exploring similar questions and additional content below.Similar questions
- The data in Table 1.5.3 were obtained from a tensile test of a metal specimen with a rectangular cross section of 0.2011in.2 in area and a gage length (the length over which the elongation is measured) of 2.000 inches. The specimen was not loaded to failure. a. Generate a table of stress and strain values. b. Plot these values and draw a best-fit line to obtain a stress-strain curve. c. Determine the modulus of elasticity from the slope of the linear portion of the curve. d. Estimate the value of the proportional limit. e. Use the 0.2 offset method to determine the yield stress.arrow_forwardA tensile test was performed on a metal specimen having a circular cross section with a diameter 0. 510 inch. For each increment of load applied, the strain was directly determined by means of a strain gage attached to the specimen. The results are, shown in Table: 1.5.1. a. Prepare a table of stress and strain. b. Plot these data to obtain a stress-strain curve. Do not connect the data points; draw a best-fit straight line through them. c. Determine the modulus of elasticity as the slope of the best-fit line.arrow_forwardA tensile test was performed on a metal specimen having a circular cross section with a diameter of 1 2 inch. The gage length (the length over which the elongation is measured) is 2 inches. For a load 13.5 kips, the elongation was 4.6610 3 inches. If the load is assumed to be within the linear elastic rang: of the material, determine the modulus of elasticity.arrow_forward
- An aluminum alloy bar with a rectangular cross section that has a width of 12.5 mm, thickness of 6.25 mm, and a gauge length of 50 mm was tested in tension to fracture according to ASTM E-8 method. The load and deformation data were as shown in Table P4.6. Using a spreadsheet program, obtain the following: a. A plot of the stress-strain relationship. Label the axes and show units. b. A plot of the linear portion of the stress-strain relationship. Determine the modulus of elasticity using the best fit approach. c. Proportional limit. d. Yield stress at an offset strain of 0.002 m/m. e. Tangent modulus at a stress of 450 MPa. f. Secant modulus at a stress of 450 MPa. TABLE P4.6 Load (kN) AL (mm) Load (kN) AL (mm) 33.5 1.486 3.3 0.025 35.3 2.189 14.0 0.115 37.8 3.390 25.0 0.220 39.8 4.829 29.0 0.406 40.8 5.961 30.6 0.705 41.6 7.386 31.7 0.981 41.2 8.047 32.7 1.245arrow_forwardThree steel bars have a diameter of 25 mm and carbon contents of 0.2, 0.5, and 0.8%, respectively. The specimens were subjected to tension until rupture. The load versus deformation results were as shown in Table P3.19. If the gauge length is 50 mm, determine the following: a. The tensile stresses and strains for each specimen at each load increment. b. Plot stresses versus strains for all specimens on one graph. TABLE P3.19 Specimen No. Carbon Content (%) 1 3 0.2 0.5 0.8 Deformation (mm) Load (kN) 0.00 0.07 133 133 133 0.10 137 191 191 0.15 142 196 285 0.50 147 201 324 1.00 140 199 383 2.50 155 236 447 5.00 196 295 491 (Rupture) 7.50 226 336 10.00 241 341 12.50 218 304 (Rupture) 13.75 196 (Rupture) c. The proportional limit for each specimen. d. The 0.2% offset yield strength for each specimen. e. The modulus of elasticity for each specimen. f. The strain at rupture for each specimen. g. Comment on the effect of increasing the carbon content on the following: Yield strength ii.…arrow_forwardQ2c) Listed in the table below is the tensile stress-strain data for different grades of steels. Utilizing the data given answer the three queries given below. Material Yield Tensile Strain at Fracture Elastic StrengthStrengthFractureStrengthModulus (MPa) (MPa) (MPa) (GPa) A 410 1440 0.63 265 410 В 200 220 0.40 105 250 C 815 950 0.25 500 610 D 800 650 0.14 720 210 E Fractures before yielding 650 550 1) Which will experience the greatest percent reduction in area? Why? 2) Which is the strongest? Why? 3) Which is the stiffest? Why?arrow_forward
- A round aluminum alloy bar with a 0.25-in. diameter and a 1-in. gauge length was tested in tension to fracture according to ASTM E-8 method. The load and deformation data were as shown in Table P4.8.Using a spreadsheet program, obtain the following: a. A plot of the stress–strain relationship. Label the axes and show units. b. A plot of the linear portion of the stress–strain relationship. Determine modulus of elasticity using the best fit approach. c. Proportional limit. d. Yield stress at an offset strain of 0.002 in/in. e. Initial tangent modulus. f. If the specimen is loaded to 3200 lb only and then unloaded, what is the permanent change in gauge length? g. When the applied load was 1239 lb, the diameter was measured as 0.249814 in. Determine Poisson’s ratio.arrow_forwardA steel specimen is tested in tension. The specimen is 25 mm wide by 5 mm thick in the test region. By monitoring the load dial of the testing machine, it was found that the specimen yielded at a load of 55 kN and fractured at 78 kN.a. Determine the tensile stresses at yield and at fracture.b. Estimate how much elongation would occur at 60% of the yield stress in a 50-mm gauge length.arrow_forwardA tensile test specimen of stainless steel alloy having a diameter of 0.495 in. and a gage length of 2.00 in. was tested to fracture. Stress and strain data obtained during the test are shown. Determine the modulus of elasticity. 120 Upper scale 90 60 Lower scale 30 0.040 0.004 0.060 0.006 0.120 0.012 0.020 0.100 0.010 0.0 0.080 0.008 0.0 0.002 Strain (in./in.) Stress (ksi)arrow_forward
- A 32-mm rebar with a gauge length of 200 mm was subjected to tension to fracture according to ASTM E-8 method. The load and deformation data were as shown in TableUsing a spreadsheet program obtain the following:a. A plot of the stress–strain relationship. Label the axes and show units.b. A plot of the linear portion of the stress–strain relationship. Determine modulus of elasticity using the best-fit approach.c. Proportional limit.d. Yield stress.e. Ultimate strength.f. If the rebar is loaded to 390 kN only and then unloaded, what is the permanent change in length?arrow_forwardA steel specimen is tested in tension. The specimen is 2 in. wide by 2.3 in. thick in the test region. By monitoring the load dial of the testing machine, it was found that the specimen yielded at a load of 30 kips and fractured at 40 kips. a) Determine the tensile stress at yield and fracture; b) If the original gauge length was 4 in., estimate the gauge length when the specimen is stressed to 2 the yield stress.arrow_forwardA grade 36 round steel bar with a diameter of 0.5 inches and a gauge length of 2 inches wassubjected to tension to rupture following ASTM E-8 test procedure. The load and deformation data wereas shown in the following table: Using a spreadsheet program obtain the following:a. A plot of the stress-strain relationship. Label the axes and show units.b. A plot of the linear portion of the stress-strain relationship. Determine modulus of elasticity usingthe best fit approach.c. Proportional limit.d. Yield stress.e. Ultimate strength.f. When the applied load was 4.07 kips, the diameter was measured as 0.499905 inches. DeterminePoisson’s ratio.g. After the rod was broken, the two parts were put back together and the diameter of at the neckwas measured as 0.416012 inches. What is the true stress value at fracture? Is the true stress atfracture larger or smaller than the engineering stress at fracture? Why?h. Do you expect the true strain at fracture to be larger or smaller than the…arrow_forward
arrow_back_ios
SEE MORE QUESTIONS
arrow_forward_ios
Recommended textbooks for you
 Steel Design (Activate Learning with these NEW ti...Civil EngineeringISBN:9781337094740Author:Segui, William T.Publisher:Cengage Learning
 Materials Science And Engineering PropertiesCivil EngineeringISBN:9781111988609Author:Charles GilmorePublisher:Cengage Learning
Steel Design (Activate Learning with these NEW ti...
Civil Engineering
ISBN:9781337094740
Author:Segui, William T.
Publisher:Cengage Learning
Materials Science And Engineering Properties
Civil Engineering
ISBN:9781111988609
Author:Charles Gilmore
Publisher:Cengage Learning
Material Properties 101; Author: Real Engineering;https://www.youtube.com/watch?v=BHZALtqAjeM;License: Standard YouTube License, CC-BY