![WebAssign for Rosner's Fundamentals of Biostatistics, 8th Edition [Instant Access], Single-Term](https://s3.amazonaws.com/compass-isbn-assets/textbook_empty_images/large_textbook_empty.svg)
Concept explainers
Videos
Research into cigarette-smoking habits, smoking prevention, and cessation programs necessitates accurate measurement of smoking behavior. However, decreasing social acceptability of smoking appears to cause significant underreporting. Chemical markers for cigarette use can provide objective indicators of smoking behavior. One widely used noninvasive marker is the level of saliva thiocyanate (SCN). In a Minneapolis school district, 1332 students in eighth grade (ages 12–14) participated in a study [12] whereby they
- (1) Viewed a film illustrating how recent cigarette use could be readily detected from small samples of saliva
- (2) Provided a personal sample of SCN
- (3) Provided a self-report of the number of cigarettes smoked per week
The results are given in Table 3.10.
TABLE 3.10 Relationship between SCN levels and self-reported cigarettes smoked per week
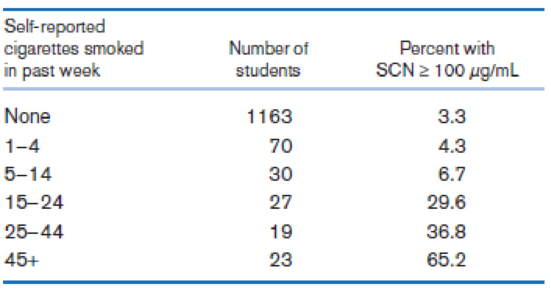
Source: Based on the American Journal of Public Health, 71(12), 1320, 1981.
Suppose the self-reports are completely accurate and are representative of the number of eighth-grade students who smoke in the general community. We are considering using an SCN level ≥ 100 μg/mL as a test criterion for identifying cigarette smokers. Regard a student as positive if he or she smokes one or more cigarettes per week.
What is the sensitivity of the test for light-smoking students (students who smoke ≤ 14 cigarettes per week)?
Want to see the full answer?
Check out a sample textbook solution
Chapter 3 Solutions
WebAssign for Rosner's Fundamentals of Biostatistics, 8th Edition [Instant Access], Single-Term


- What is meant by the sample space of an experiment?arrow_forwardA food-frequency questionnaire is used to measure dietary intake. The respondent specifies the number of servings of various food items they consumed over the previous week. The dietary cholesterol is then quantified for each respondent. The researchers were interested in assessing if there was an association between dietary cholesterol intake and high blood pressure. In a large sample of individuals who had completed the questionnaire, 250 persons with a high dietary cholesterol intake (greater than 300 mg /day) were selected and 250 persons with a low dietary cholesterol intake (less than 300 mg/day) were selected. The 500 selected participants had their medical history taken and were classified as having normal or high blood pressure. The data are given here. Dietary Cholesterol Blood Pressure Total High Low High 159 91 250 Low 78 172 250 Total 237 263 500 Two hypothesis tests can be used to answer this research problem. Test 1:…arrow_forwardTourism is extremely important to the economy of Florida. Hotel occupancy is an often-reported measure of visitor volume and visitor activity (Orlando Sentinel, May 19, 2018). Hotel occupancy data for February in two consecutive years are as follows. Current Year Previous Year Occupied Rooms 1,584 1,445 Total Rooms 1,800 1,700 a. Formulate the hypothesis test that can be used to determine whether there has been an increase in the proportion of rooms occupied over the one-year period. Let pi population proportion of rooms occupied for current year P2 = population proportion of rooms occupied for previous year Ho : P1 - P2 - Select your answer - Ha : P1 – P2 - Select your answer - b. What is the estimated proportion of hotel rooms occupied each year (to 2 decimals)? Current year Previous Year c. Conduct a hypothesis test. What is the p-value (to 4 decimals)? Use Table 1 from Appendix B. p-value = Using a 0.05 level of significance, what is your conclusion? We -Select your answer - that…arrow_forward
- Tourism is extremely important to the economy of Florida. Hotel occupancy is an often-reported measure of visitor volume and visitor activity (Orlando Sentinel, May 19, 2018). Hotel occupancy data for February in two consecutive years are as follows. Current Year Previous Year Occupied Rooms 1,470 1,377 Total Rooms 1,750 1,700 a. Formulate the hypothesis test that can be used to determine whether there has been an increase in the proportion of rooms occupied over the one-year period. Let pi population proportion of rooms occupied for current year P2 population proportion of rooms occupied for previous year Ho : P1 - P2 - Select your answer - На : р1 P2 - Select your answer - b. What is the estimated proportion of hotel rooms occupied each year (to 2 decimals)? Current year Previous Year c. Conduct a hypothesis test. What is the p-value (to 4 decimals)? Use Table 1 from Appendix B. p-value %3D Using a 0.05 level of significance, what is your conclusion? We - Select your answer - v that…arrow_forwardThe National Highway traffic Safety Administration requires each U.S. state to carry out an observational study to assess the level of seat belt use in the state. One report summarized data from a study done in a certain state. The proportions in the accompanying table are based on observations of over 25,000 drivers and passengers. Uses Seatbelt Does Not Use Seat Belt Male 0.425 0.075 Female 0.452 0.048 Assume that these proportions are representative of adults in this state and that an adult from this state is selected at random. (a) What is the probability that the selected adult uses a seat belt? (b) What is the probability that the selected adult uses a seat belt given that the individual selected is male?arrow_forwardDo truck drivers get into more accidents than people who drive SUVs? Researchers use police records of automobile accidents over the past year and vehicle registrations to compare the percentage of drivers of vehicles of each type that get into accidents. 1: A survey 2: An observational study that is not a survey 3: An experimental studyarrow_forward
- What is the observational study design used in the study Objective: We evaluated the associations of long-term changes in consumption of sugary beverages (including sugar-sweetened beverages and 100% fruit juices) and artificially sweetened beverages (ASBs) with subsequent risk of type 2 diabetes. Research design and methods: We followed up 76,531 women in the Nurses' Health Study (1986-2012), 81,597 women in the Nurses' Health Study II (1991-2013), and 34,224 men in the Health Professionals' Follow-up Study (1986-2012). Changes in beverage consumption (in 8-ounce servings/day) were calculated from food frequency questionnaires administered every 4 years. Results: During 2,783,210 person-years of follow-up, we documented 11,906 incident cases of type 2 diabetes. After adjustment for BMI and initial and changes in diet and lifestyle covariates, increasing total sugary beverage intake (including both sugar-sweetened beverages and 100% fruit juices) by >0.50 serving/day over a…arrow_forwardTourism is extremely important to the economy of Florida. Hotel occupancy is an often-reported measure of visitor volume and visitor activity (Orlando Sentinel, May 19, 2018). Hotel occupancy data for February in two consecutive years are as follows. Current Year Previous Year Occupied Rooms 1,360 1,386 Total Rooms 1,700 1,800 a. Formulate the hypothesis test that can be used to determine whether there has been an increase in the proportion of rooms occupied over the one-year period. Let pi = population proportion of rooms occupied for current year Pa= population proportion of rooms occupied for previous year Ho : Pi - Pa H.: Pi - P2 Select your answer Select your answer b. What is the estimated proportion of hotel rooms occupied each year (to 2 decimals)? Current year Previous Year c. Conduct a hypothesis test. What is the p-value (to 4 decimals)? Use Table 1 from Appendix B. p-value - Using a 0.05 level of significance, what is your conclusion? We Select your answer- vthat there has…arrow_forwardTourism is extremely important to the economy of Florida. Hotel occupancy is an often-reported measure of visitor volume and visitor activity (Orlando Sentinel, May 19, 2018). Hotel occupancy data for February in two consecutive years are as follows. Current Year Previous Year Occupied Rooms 1,435 1,343 Total Rooms 1,750 1,700 a. Formulate the hypothesis test that can be used to determine whether there has been an increase in the proportion of rooms occupied over the one-year period. Let pi = population proportion of rooms occupied for current year = td population proportion of rooms occupied for previous year Но : Рі — Р2 Select your answer - На : Рі — Р2 - Select your answer - b. What is the estimated proportion of hotel rooms occupied each year (to 2 decimals)? Current year Previous Year c. Conduct a hypothesis test. What is the p-value (to 4 decimals)? Use Table 1 from Appendix B. p-value %3D Using a 0.05 level of significance, what is your conclusion? We - Select your answer - v…arrow_forward
- Tourism is extremely important to the economy of Florida. Hotel occupancy is an often-reported measure of visitor volume and visitor activity (Orlando Sentinel, May 19, 2018). Hotel occupancy data for February in two consecutive years are as follows. Current Year 1,476 1,800 Occupied Rooms Total Rooms 1,422 1,800 a. Formulate the hypothesis test that can be used to determine whether there has been an increase in the proportion of rooms occupied over the one-year period. Let P₁= population proportion of rooms occupied for current year P2 population proportion of rooms occupied for previous year - P2 less than or equal to 0 greater than 0 Ho P1 Ha P1 P2 b. What is the estimated proportion of hotel rooms occupied each year (to 2 decimals)? Current year .80 X Previous Year .77 c. Conduct a hypothesis test. What is the p-value (to 4 decimals)? Use Table 1 from Appendix B. Previous Year p-value = 0.0166 Using a 0.05 level of significance, what is your conclusion? We can conclude that there…arrow_forwardTourism is extremely important to the economy of Florida. Hotel occupancy is an often-reported measure of visitor volume and visitor activity (Orlando Sentinel, May 19, 2018). Hotel occupancy data for February in two consecutive years are as follows. Current Year 1,394 1,700 Occupied Rooms Total Rooms a. Formulate the hypothesis test that can be used to determine whether there has been an increase in the proportion of rooms occupied over the one-year period. Let p₁ = population proportion of rooms occupied for current year P2 = population proportion of rooms occupied for previous year 0.82 Previous Year 1,404 1,800 Ho: P1 P2 less than or equal to 0 Ha P₁ P2 greater than 0 b. What is the estimated proportion of hotel rooms occupied each year (to 2 decimals)? Current year Previous Year c. Conduct a hypothesis test. What is the p-value (to 4 decimals)? Use Table 1 from Appendix B. 0.78arrow_forwardTourism is extremely important to the economy of Florida. Hotel occupancy is an often-reported measure of visitor volume and visitor activity (Orlando Sentinel, May 19, 2018). Hotel occupancy data for February in two consecutive years are as follows. Previous Year Occupied Rooms Total Rooms Current Year 1,505 1,750 1,577 1,900 a. Formulate the hypothesis test that can be used to determine whether there has been an increase in the proportion of rooms occupied over the one-year period. Let P₁ = population proportion of rooms occupied for current year P2 = population proportion of rooms occupied for previous year Ho: P1 P2 less than or equal to 0 Ha P₁ P2 greater than 0 b. What is the estimated proportion of hotel rooms occupied each year (to 2 decimals)? Current year Previous Year c. Conduct a hypothesis test. What is the p-value (to 4 decimals)? Use Table 1 from Appendix B. p-value = Using a 0.05 level of significance, what is your conclusion? We can conclude that there has been an…arrow_forward
 Glencoe Algebra 1, Student Edition, 9780079039897...AlgebraISBN:9780079039897Author:CarterPublisher:McGraw Hill
 Big Ideas Math A Bridge To Success Algebra 1: Stu...AlgebraISBN:9781680331141Author:HOUGHTON MIFFLIN HARCOURTPublisher:Houghton Mifflin Harcourt
 College Algebra (MindTap Course List)AlgebraISBN:9781305652231Author:R. David Gustafson, Jeff HughesPublisher:Cengage Learning