![WebAssign for Rosner's Fundamentals of Biostatistics, 8th Edition [Instant Access], Single-Term](https://s3.amazonaws.com/compass-isbn-assets/textbook_empty_images/large_textbook_empty.svg)
Concept explainers
Videos
Mental Health
The Chinese Mini-Mental Status Test (CMMS) consists of 114 items intended to identify people with Alzheimer’s disease and senile dementia among people in China [14]. An extensive clinical evaluation of this instrument was performed, whereby participants were interviewed by psychiatrists and nurses and a definitive diagnosis of dementia was made. Table 3.13 shows the results obtained for the subgroup of people with at least some formal education.
TABLE 3.13 Relationship of clinical dementia to outcome on the Chinese Mini-Mental Status Test
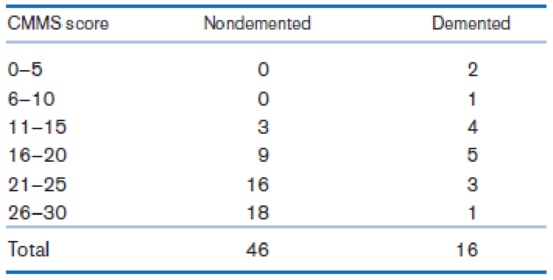
Suppose we want both the sensitivity and specificity to be at least 70%. Use the ROC curve to identify the possible value(s) to use as the cutoff for identifying people with dementia, based on these criteria.
Want to see the full answer?
Check out a sample textbook solution
Chapter 3 Solutions
WebAssign for Rosner's Fundamentals of Biostatistics, 8th Edition [Instant Access], Single-Term


- What is meant by the sample space of an experiment?arrow_forwardWhat is an experiment?arrow_forwardTwenty samples of students from the first year were taken for the study related to student emotional intelligence (EQ) in a university. The researcher has collected the data for a few variables: gender, academic performance, and emotional intelligence (EQ) test score. EQ Training and Coaching(T & C) Programme EQ Score No Gender CGPA (Before Attend T & C) EQ Score (After Attend T & C) 1 Male 2.10 444 526 2 Female 4.00 780 862 3 Male 2.30 475 557 4 Male 2.40 490 572 5 Female 3.80 755 837 6 Female 3.90 766 848 7 Male 2.70 540 622 Male 3.10 623 705 9 Male 2.90 600 682 10 Male 3.00 620 702 11 Male 2.50 505 590 12 Female 3.20 640 725 13 Male 2.60 523 608 14 Female 3.40 700 785 15 Female 3.50 710 795 16 Female 3.60 726 811 17 Female 3.70 740 825 18 Male 2.80 550 635 19 Female 3.30 685 770 20 Male 2.20 460 545 Table 1 Remarks: (1) Range of CGPA: 0 to 4 (2) Range of EQ Score: 0 to 900 Use the sample data from table 1, perform hypothesis testing to determine whether there is a difference in the…arrow_forward
- U.S. Department of Transportation As an auto insurance risk analyst, it is your job to research risk profiles for various types of drivers. One common area of concern for auto insurance companies is the risk involved when offering policies to younger, less experienced drivers. The U.S. Department of Transportation recently conducted a study in which it analyzed the relationship between 1) the number of fatal accidents per 1000 licenses, and 2) the percentage of licensed drivers under the age of 21 in a sample of 42 cities. Your first step in the analysis is to construct a scatterplot of the data. FIGURE. SCATTERPLOT FOR U.S. DEPARTMENT OF TRANSPORATION PROBLEM U.S. Department of Transportation The Relationship Between Fatal Accident Frequency and Driver Age 4.5 4. 3.5 3. 2.5 1.5 0.5 0. 6. 8 10 12 14 16 18 20 Percentage of drivers under age 21 pon visual inspection, you determine that the variables do have a linear relationship. After a linear pattern has been established visually, you…arrow_forwardAsian Americans are a heterogeneous group often coined as one in national and state estimates of health data. Recent studies, however, have shown that some Asian American subgroups are more likely to die early due to cardiovascular disease and more likely to report metabolic syndrome. An epidemiologist wants to study the age of diagnosis of type 2 diabetes among two Asian American subgroups (Asian Indians, Koreans). The researcher had the following two questions: Is the mean age of diagnosis for type 2 diabetes among Asian Indians different than 55 years? Is the mean age of diagnosis of type 2 diabetes different between Koreans and Asian Indians? The epidemiologist should conduct which types of tests to answer the above 2 questions? None two-sample t test after checking for equal variance and a one sample t-test One-sample t test and two-sample t test after checking for equal variance One-sample t test and ANOVA One-sample t test and ANOVAarrow_forward2. Researchers interested in determining if there is a relationship between death anxiety and religiosity conducted the following study. Subjects completed a death anxiety scale (high score = high anxiety) and also completed a checklist designed to measure an individuals degree of religiosity (belief in a particular religion, regular attendance at religious services, number of times per week they regularly pray, etc.) (high score = greater religiosity . A data sample is provided below. What is the degree of relationship between the two variables? Death Anxiety Religiosity 38 4 42 3 29 11 31 5 28 15 24 14 17 9 19 10 11 15 8 19 19 17 3 10 14 14 6 18arrow_forward
- How might the absence of data screening affect a researcher’s data quality, their interpretations of the data, and thereby their interpretations of their study’s findings?arrow_forwardIs gender independent of education level ? A random sample of 395 people were surveyed and each person was asked to report the highest education level they obtained .The data that resulted from the survey is summarized in the following table: High School Bachelors Masters PhD. Female 60 54 46 41 Male 40 44 53 57 Question: Are gender and education level dependent at 5percent level of significance ? In other words given the data collected above is there a relationship between the gender of an individual and the level of education that they have obtained ?arrow_forwardMental Health A study was performed looking at the effect of physical activity on cognitive function among adults at high risk for Alzheimer's disease. There were 170 eligible subjects randomly assigned to either an exercise intervention (exercise group) or a control intervention (control group). The subjects were followed at 6-month intervals up to 18 months of follow-up. The primary assessment scale was the Alzheimer's Disease Assessment Scale-Cognitive Subscale (ADAS-Cog). The results at 18 months of follow-up among participants with mild cognitive impairment are given in the table below. (Let population 1 be the exercise group and population 2 be the control group. Use exercise group control group.) Mean difference from baseline (18-month score minus baseline score) among participants with mild cognitive impairment in the ADAS-Cog score* Mean change 95% CI n H₁: Exercise group Control group USE SALT -0.37 (-1.37, 0.63) 48 -0.43 (-1.35, 0.49) 52 (a) What is the standard deviation of…arrow_forward
- A study examined the relationship between a nurse's assessment of a patient's facial expression and his or her self-reported level of pain. Data for 89 patients are summarized below: Self-Report Facial Expression No Pain Pain No Pain 17 40 Pain 3 29 We'd like to determine if there is evidence of an association between a facial expression that reflects pain and self-report pain, because dementia patients do not always give a verbal indication that they are in pain. By using SPSS or Minitab, design the appropriate test and generate the data analyses. Relate the results of the test to the research question and conclude the findings.arrow_forwardI’m being asked to construct an anova table to compare the effects of three drugs, drug a(control) , drug b, and drug c. Is this an anova model I or II and why?arrow_forwardThe article "Display of Health Risk Behaviors on MySpace by Adolescents"+ described a study in which researchers looked at a random sample of 500 publicly accessible MySpace web profiles posted by 18-year-olds. The content of each profile was analyzed. One of the conclusions reported was that displaying sport or hobby involvement was associated with decreased references to risky behavior (sexual references or references to substance abuse or violence). (a) Is the study described an observational study or an experiment? an observational study an experiment (b) Is it reasonable to generalize the stated conclusion to all 18-year-olds with a publicly accessible MySpace web profile? What aspect of the study supports your answer? No, it is not reasonable to generalize the stated conclusion since the study didn't include all 18-year-olds on MySpace. No, it is not reasonable to generalize the stated conclusion since the study was an experiment and you cannot generalize conclusions to…arrow_forward
 Glencoe Algebra 1, Student Edition, 9780079039897...AlgebraISBN:9780079039897Author:CarterPublisher:McGraw Hill
 Big Ideas Math A Bridge To Success Algebra 1: Stu...AlgebraISBN:9781680331141Author:HOUGHTON MIFFLIN HARCOURTPublisher:Houghton Mifflin Harcourt
 College Algebra (MindTap Course List)AlgebraISBN:9781305652231Author:R. David Gustafson, Jeff HughesPublisher:Cengage Learning