
Videos
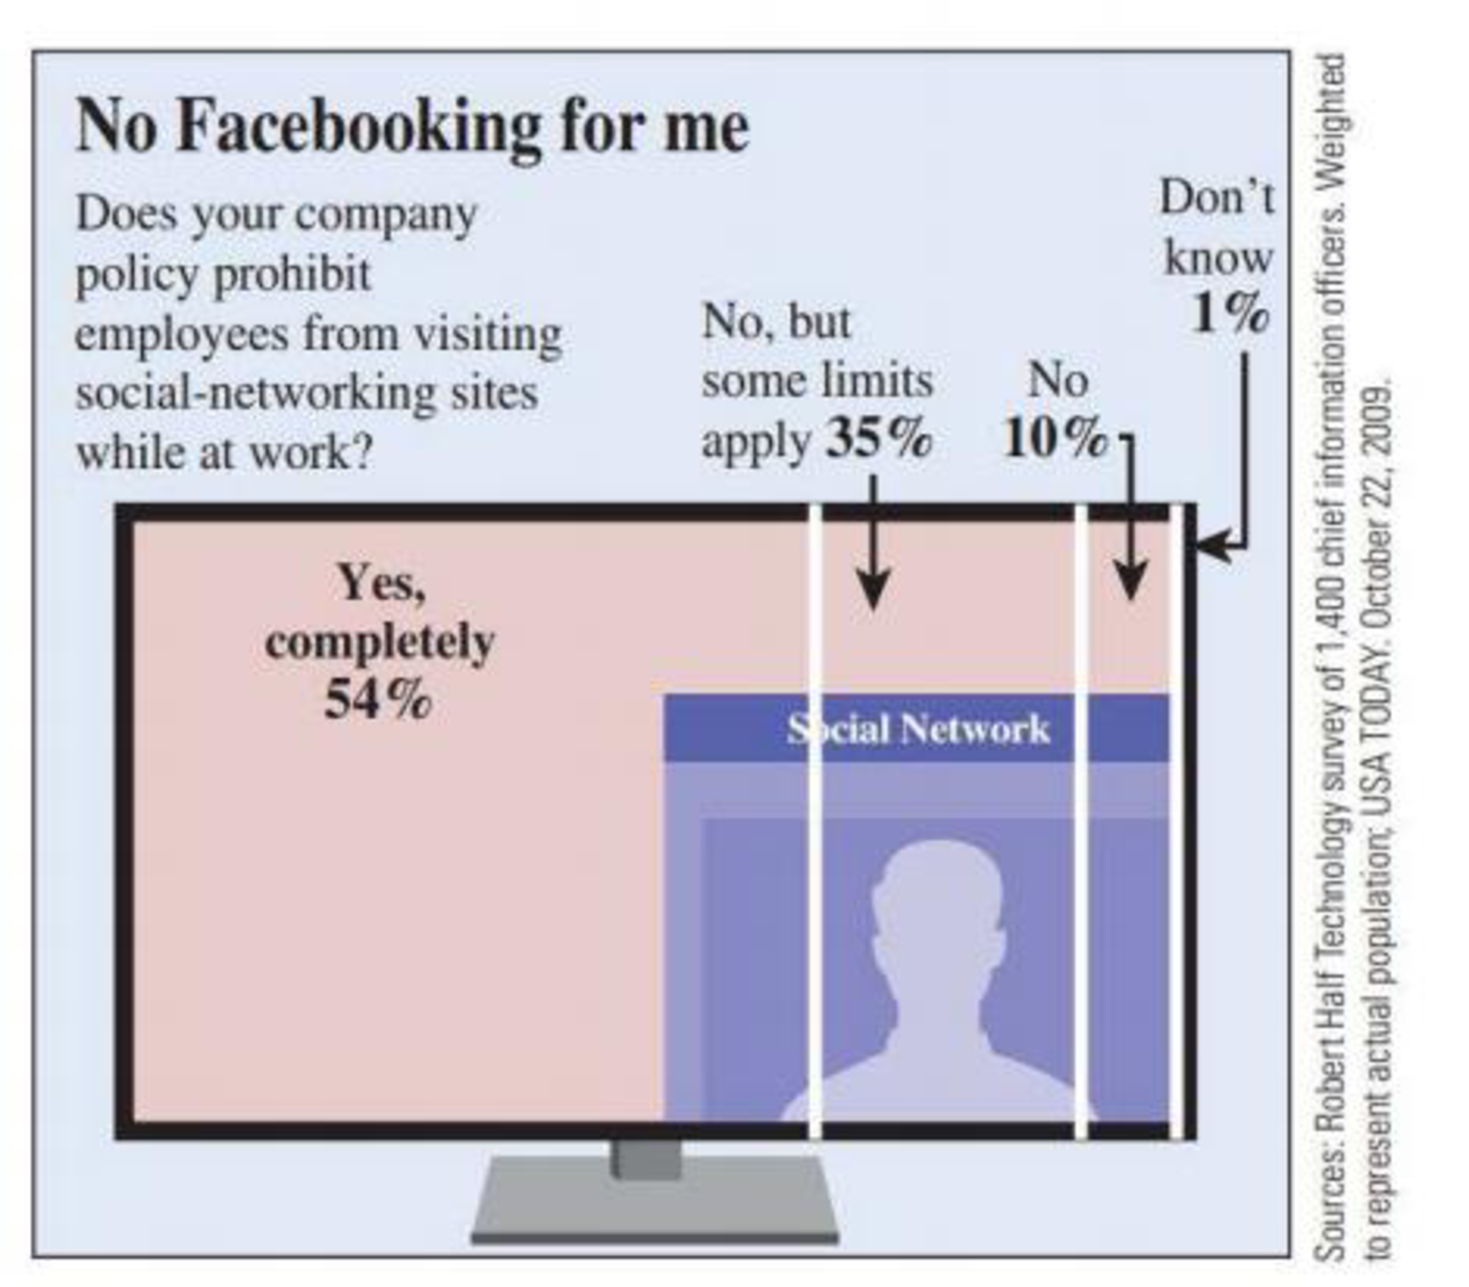
The graphical display on the next page is similar to one that appeared in USA TODAY (October 22, 2009). It summarizes survey responses to a question about whether visiting social networking sites is allowed at work. Which of the graph types introduced in this section is used to display the responses? (USA TODAY frequently adds artwork and text to their graphs to try to make them look more interesting.)

Trending nowThis is a popular solution!

Chapter 3 Solutions
Introduction to Statistics and Data Analysis
Additional Math Textbook Solutions
STATISTICS F/BUSINESS+ECONOMICS-TEXT
Elementary Statistics Using Excel (6th Edition)
Elementary Statistics Using the TI-83/84 Plus Calculator, Books a la Carte Edition (4th Edition)
Elementary Statistics Using The Ti-83/84 Plus Calculator, Books A La Carte Edition (5th Edition)
Statistics: Informed Decisions Using Data (5th Edition)
Elementary Statistics: Picturing the World (7th Edition)


- Explain in your own words the difference between the mean, median, and mode of a set of numbers.arrow_forwardWhat is the importance of using pie/bar charts or graph when representing data?arrow_forwardCreate your own z-score example problem (make a math word problem). What is the numerical answer for your math word problem. How would the z-score graph look like and what would it indicate based on the answerarrow_forward
- A group of 20 young adults was asked about their political party affiliation (examples are Democrat, Republican, Libertarian, or Green Party), and the results can be downloaded from the data file Political Affiliation. In StatKey, which menu option would you select under "Descriptive Statistics and Graphs" to graph the data? One Quantitative Variable One Categorical Variable One Quantitative and One Categorical Variablearrow_forwardEach year Money magazine publishes a list of "Best Places to Live in the United States." These listings are based on affordability, educational performance, convenience, safety, and livability. The below table shows the median household income of Money magazine’s top city in each U.S. state for (Money magazine website). Click on the datafile logo to reference the data. City Median Household Income ($) City Median Household Income ($) Pelham, AL 66,772 Bozeman, MT 49,303 Juneau, AK 84,101 Papillion, NE 79,131 Paradise Valley, AZ 138,192 Sparks, NV 54,230 Fayetteville, AR 40,835 Nashua, NH 66,872 Monterey Park, CA 57,419 North Arlington, NJ 73,885 Lone Tree, CO 116,761 Rio Rancho, NM 58,982 Manchester, CT 64,828 Valley Stream, NY 88,693 Hockessin, DE 115,124 Concord, NC 54,579 St. Augustine, FL 47,748 Dickinson, ND 71,866 Vinings, GA 73,103 Wooster, OH 43,054 Kapaa, HI 62,546 Mustang, OK 66,714…arrow_forwardOn December 17, 2007 baseball writer John Hickey wrote an article for the Seattle P-I about increases to ticket prices for Seattle Mariners games during the 2008 season. The article included a data set that listed the average ticket price for each MLB team, the league in which the team plays (AL or NL), the number of wins during the 2007 season and the cost per win (in dollars). The data for the 16 National League teams are shown below. team league price wins cost/win Arizona Diamondbacks NL 19.68 90 35.40 Atlanta Braves NL 17.07 84 32.89 Chicago Cubs NL 34.30 85 65.33 Cincinnati Reds NL 17.90 72 40.32 Colorado Rockies NL 14.72 90 26.67 Florida Marlins NL 16.70 71 38.13 Houston Astros NL 26.66 73 59.11 Los Angeles Dodgers NL 20.09 82 34.64 Milwaukee Brewers NL 18.11 83 35.37 N.Y. Mets NL 25.28 88 46.56 Philadelphia Phillies NL 26.73 89 48.69 Pittsburgh Pirates NL 17.08 68 40.67 San Diego Padres NL 20.83 89 38.15 San Francisco Giants NL 24.53 71…arrow_forward
- Please help asap with this. thank you!arrow_forwardEach week the Wall Street Journal and Harris Interactive track the opinions and experiences of college recruiters for large corporations and summarize the results in the Business School Survey. Data have been gathered for the top 10 business schools from a list of 76 and is summarized below. Please complete the questions below and upload this document and your EXCEL document to the portal in CANVAS. School Ranking Enrollment (# of full-time students) Annual Tuition ($) Mean GMAT % with Job Offer Average Salary ($) Dartmouth 1 503 38,400 704 89 119,800 Michigan 2 1873 33,076 690 91 105,986 Carnegie Mellon 3 661 38,800 691 93 95,531 Northwestern 4 2650 38,844 700 94 117,060 Yale 5 468 36,800 696 86 104,018 Pennsylvania 6 1840 40,458 716 92 117,471 California Berkeley 7 1281 21,512 701 92 112,699 Columbia 8 1796 38,290 709 95 126,319 North…arrow_forwardThe bar graph shows median yearly earnings of full-time workers in the United States for people 25 years and over with a college education, by final degree earned. (See the attached graph.) The median yearly salary of an American whose final degree is a master’s is $70 thousand less than twice that of an American whose final degree is a bachelor’s. Combined, two people with each of these educational attainments earn $173 thousand. Find the median yearly salary of Americans with each of these final degrees.arrow_forward
- Find an example of a Health or Medicine bar graph and a histogram arising from data in that area. For your example, use the bar graph and the histogram to explain what the data being represented is for the bar graph and the histogram.arrow_forwardIn a certain company, every worker was given a $900 raise. How does this affect the median of the salaries? range?arrow_forwardThe Quality Manager at SodaPop Inc. thinks that there is a relationship between the temperature of the productand the percent foam for a soda. Create a scatter diagram with the following data, from the last 20 days. Is theQuality Manager correct, is there a relationship between the variables? If so, how would you describe therelationship?Turn in your scatter diagram and a short answer to the questions above. Be sure to use good graphing techniques. DayProduct Temperature inDegress Celsius % Foam1 2.2222 152 3.3333 193 2.7778 214 6.6667 305 7.7778 366 3.8889 207 5.0000 258 8.3333 369 3.8889 2210 4.4444 2311 6.6667 3212 5.5556 3313 3.3333 2014 5.0000 2715 7.2222 3516 9.4444 3817 10.0000 4018 8.8889 4219 7.7778 4020 5.0000 30arrow_forward
 Glencoe Algebra 1, Student Edition, 9780079039897...AlgebraISBN:9780079039897Author:CarterPublisher:McGraw Hill
 Big Ideas Math A Bridge To Success Algebra 1: Stu...AlgebraISBN:9781680331141Author:HOUGHTON MIFFLIN HARCOURTPublisher:Houghton Mifflin Harcourt
 Holt Mcdougal Larson Pre-algebra: Student Edition...AlgebraISBN:9780547587776Author:HOLT MCDOUGALPublisher:HOLT MCDOUGAL