
Introduction to Statistics and Data Analysis
5th Edition
ISBN: 9781305750999
Author: Peck Olson Devore
Publisher: CENGAGE C
expand_more
expand_more
format_list_bulleted
Concept explainers
Videos
Textbook Question
Chapter 3.5, Problem 49E
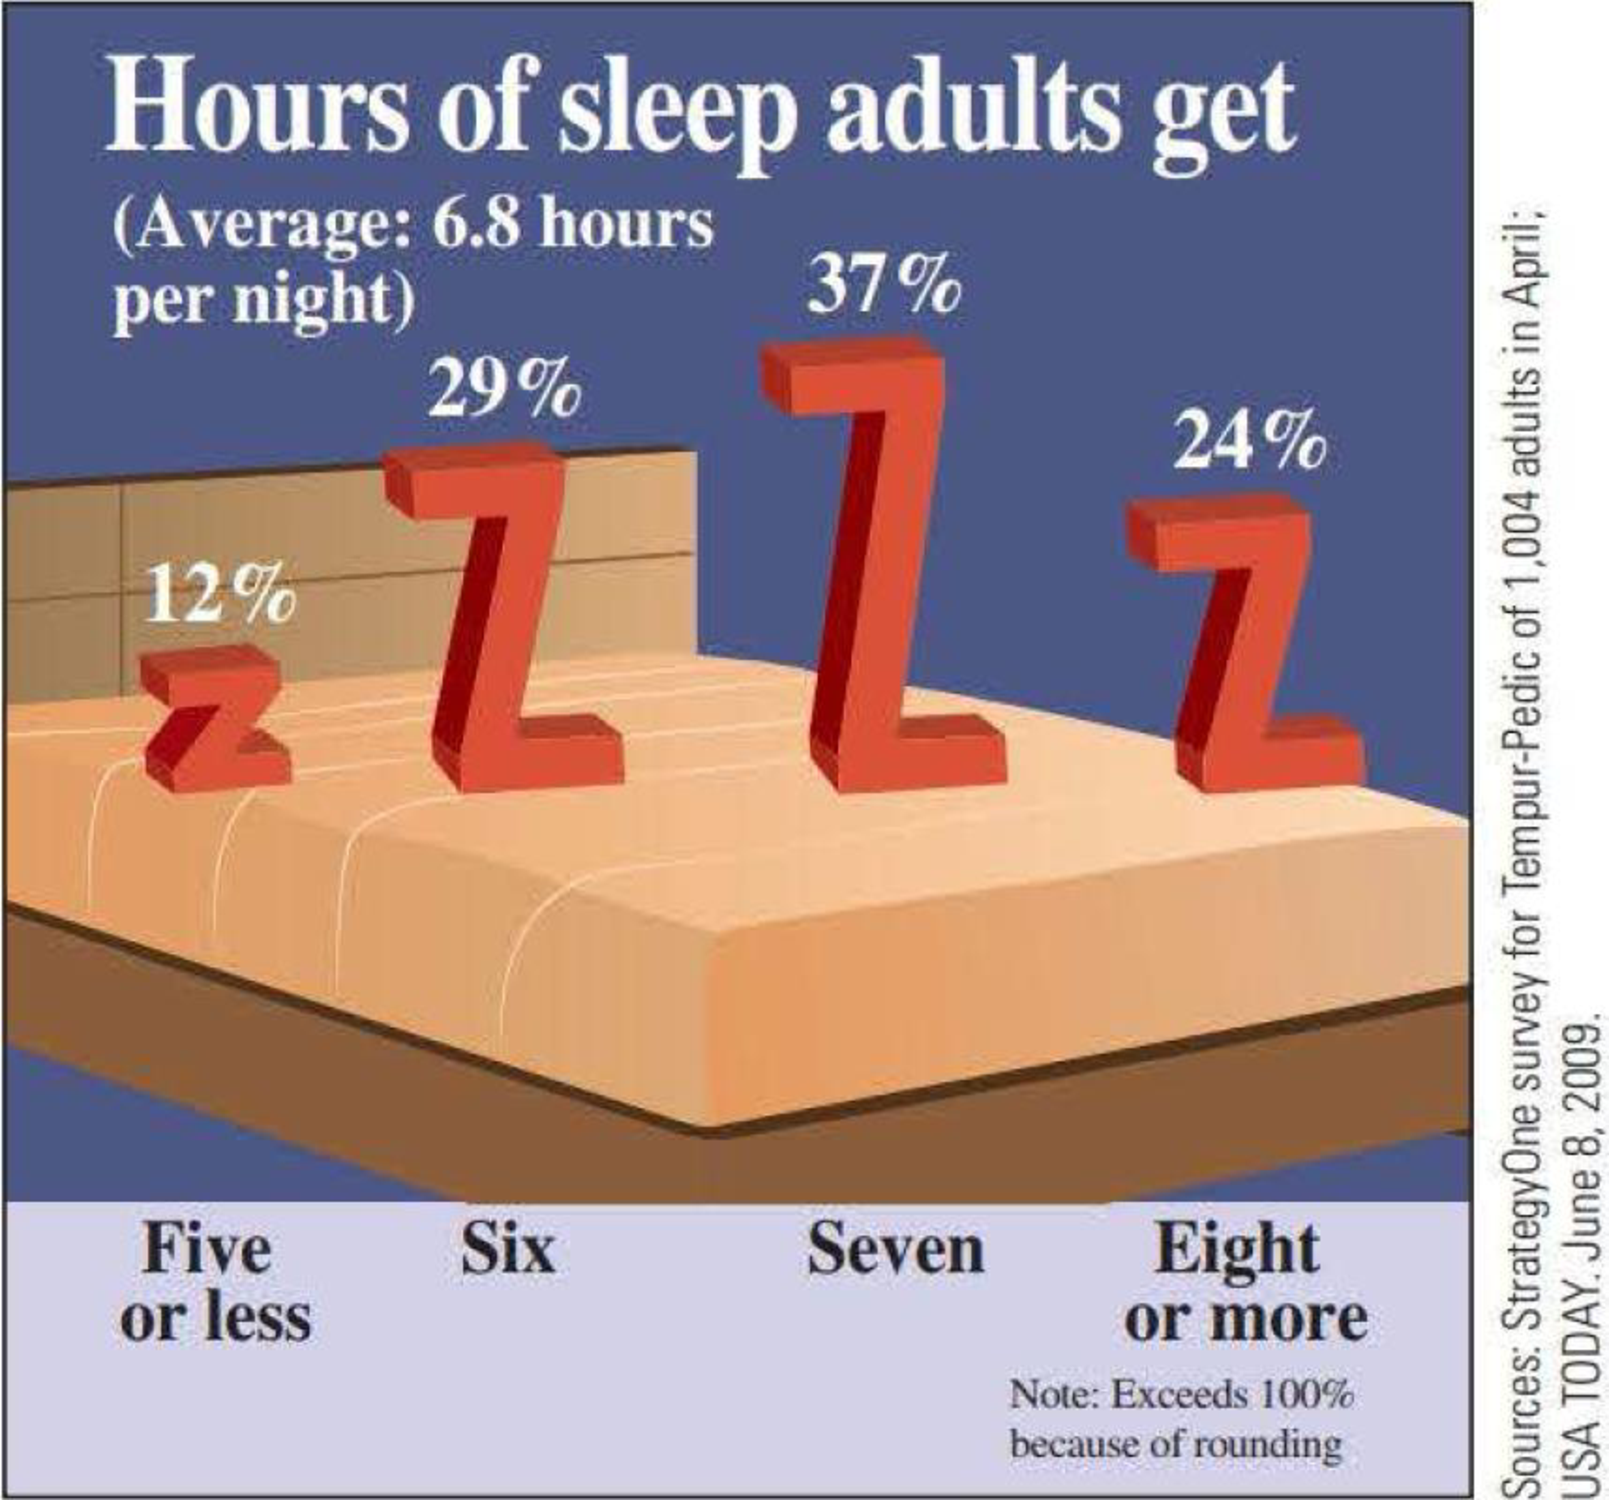
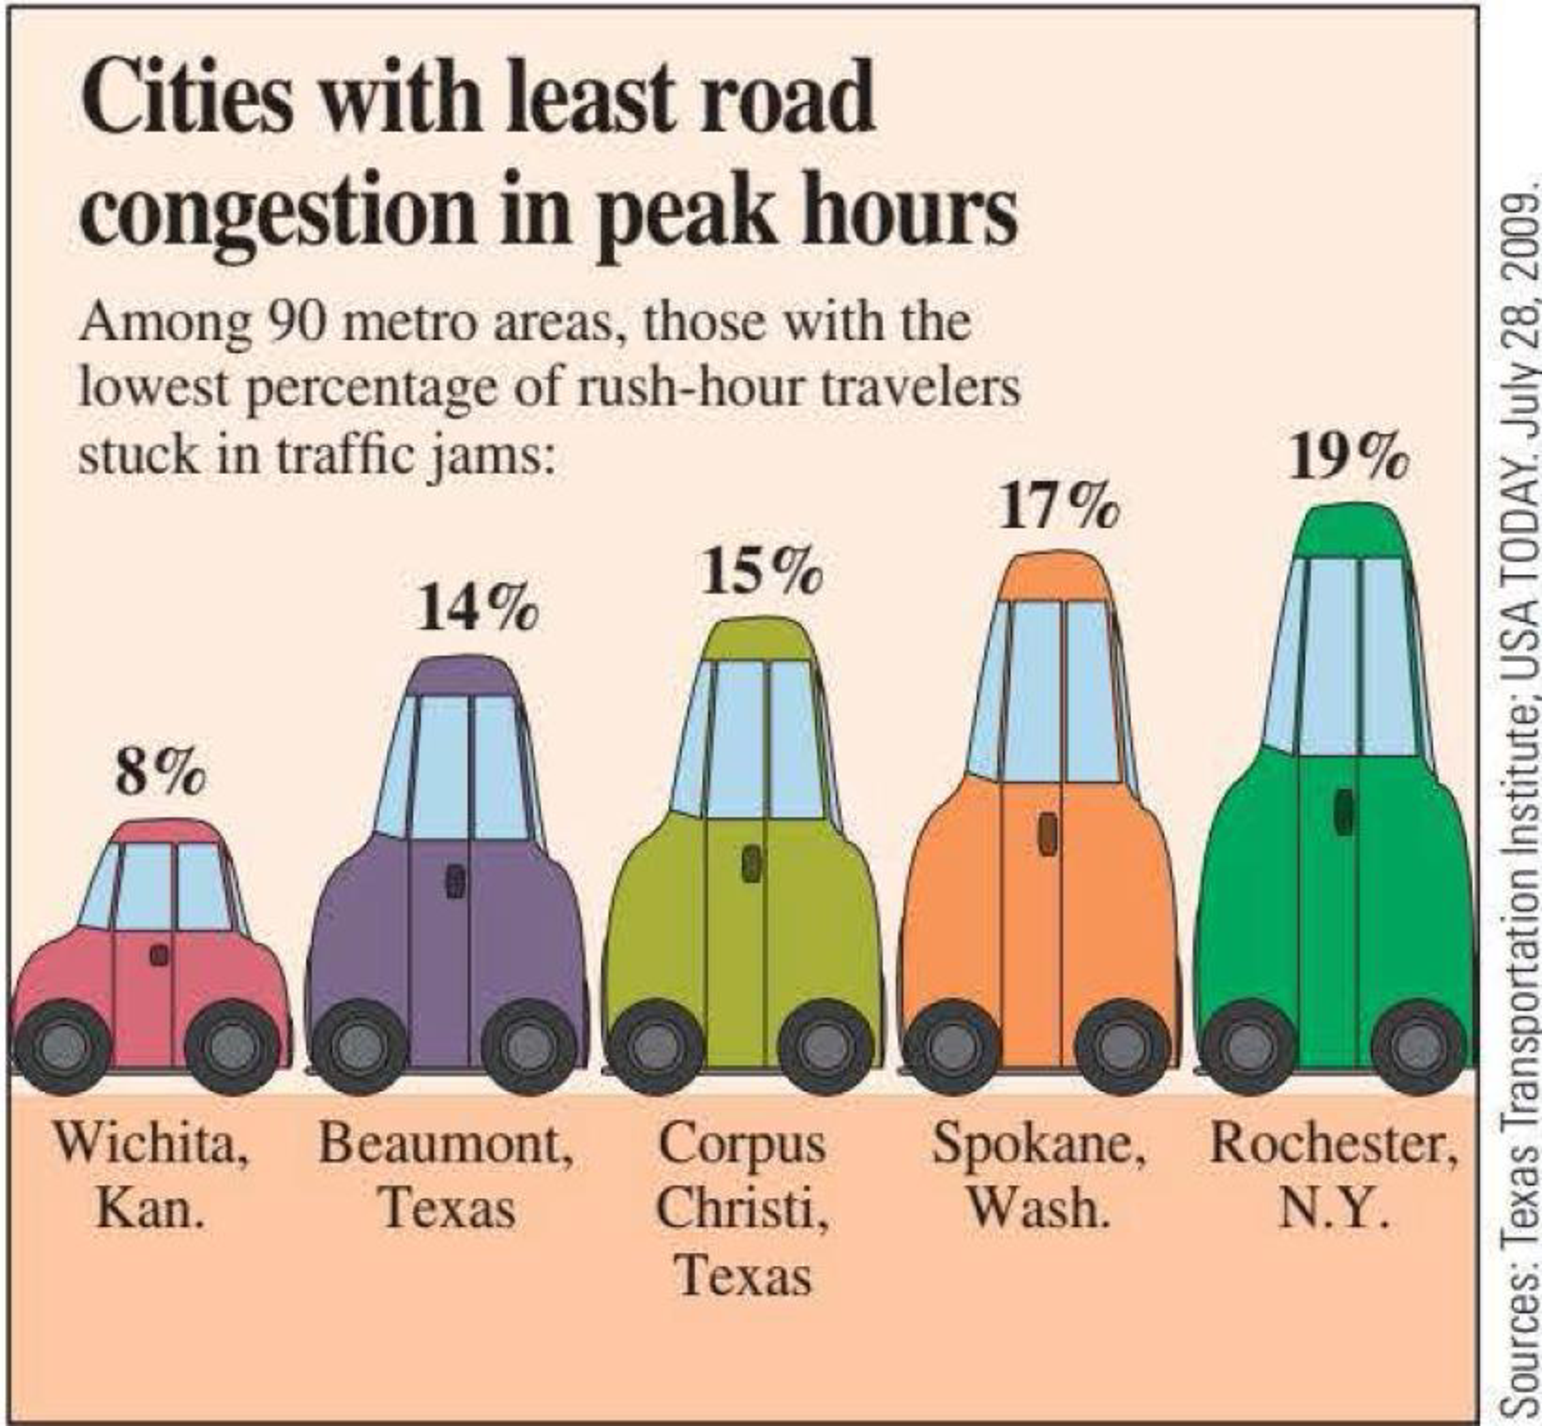
The two graphical displays below are similar to ones that appeared in USA TODAY (June 8, 2009 and July 28, 2009). One is an appropriate representation and the other is not. For each of the two, explain why it is or is not drawn appropriately.
Expert Solution & Answer
Want to see the full answer?
Check out a sample textbook solution
Students have asked these similar questions
In class, we compared healing times for females who received an experimental cold sore medicine. The data for the male control and treatment groups are provided below; they represent the number of days that passed before the sores were completely gone. In your notebook, make a dotplot for each group.
Control: 20,13,22,21,16,5,21,11,16,14,15,15,13,16,10,17,16,11,21
Treatment: 11,16,8,16,15,12,11,12,12,9,11,19,16,13,5,15,12,8,11
Part A: Calculate the mean healing time for the control group, rounding your result to the nearest hundredth. In your notebook, mark an "X" on the horizontal axis of your dotplot to show the mean.Mean = daysPart B: Calculate the mean healing time for the treatment group, rounding your result to the nearest hundredth. In your notebook, mark an "X" on the horizontal axis of your dotplot to show the mean.Mean = days
please assist where the blank areas are on the table.
Are there differences in airfare depending on which travel agency website you utilize? The following data were collected on travel agency websites on July , . The following table contains the prices in U.S. dollars for a one-way ticket between the cities listed on the left for each of the three travel agency websites. Here the pairs of cities are the blocks and the treatments are the different websites.
data below in table:
Websites
Flight From ‒ To
Expedia ($)
TripAdvisor ($)
Priceline ($)
Atlanta to Seattle
176.00
166.00
175.80
New York to Los Angeles
195.00
195.00
206.20
Cleveland to Orlando
77.00
72.00
76.21
Dallas to Indianapolis
149.00
149.00
148.20
Use to test for any significant differences in the mean price of a one-way airline ticket for the three travel agency websites. If your…
what is mode?
Chapter 3 Solutions
Introduction to Statistics and Data Analysis
Ch. 3.1 - Each person in a nationally representative sample...Ch. 3.1 - The graphical display on the next page is similar...Ch. 3.1 - Prob. 3ECh. 3.1 - The National Confectioners Association asked 1006...Ch. 3.1 - College student attitudes about e-books were...Ch. 3.1 - Prob. 6ECh. 3.1 - Prob. 7ECh. 3.1 - Prob. 8ECh. 3.1 - Prob. 9ECh. 3.1 - The survey on student attitude toward e-books...
Ch. 3.1 - Prob. 11ECh. 3.1 - Prob. 12ECh. 3.1 - An article about college loans (New Rules Would...Ch. 3.1 - Prob. 14ECh. 3.2 - Prob. 15ECh. 3.2 - Prob. 16ECh. 3.2 - Prob. 17ECh. 3.2 - The article Economy Low, Generosity High (USA...Ch. 3.2 - Prob. 19ECh. 3.2 - A report from Texas Transportation Institute...Ch. 3.2 - The percentage of teens not in school or working...Ch. 3.3 - Prob. 22ECh. 3.3 - The accompanying data on annual maximum wind speed...Ch. 3.3 - The accompanying relative frequency table is based...Ch. 3.3 - Prob. 25ECh. 3.3 - Medicares new medical plans offer a wide range of...Ch. 3.3 - The following two relative frequency distributions...Ch. 3.3 - Prob. 28ECh. 3.3 - The report Trends in College Pricing 2012...Ch. 3.3 - An exam is given to students in an introductory...Ch. 3.3 - The accompanying frequency distribution summarizes...Ch. 3.3 - Example 3.19 used annual rainfall data for...Ch. 3.3 - Prob. 33ECh. 3.3 - Prob. 34ECh. 3.3 - Prob. 35ECh. 3.3 - Prob. 36ECh. 3.3 - Using the five class intervals 100 to 120, 120 to...Ch. 3.4 - Prob. 38ECh. 3.4 - Consumer Reports Health (consumerreports.org) gave...Ch. 3.4 - Prob. 40ECh. 3.4 - Prob. 41ECh. 3.4 - Prob. 42ECh. 3.4 - Prob. 43ECh. 3.4 - Prob. 44ECh. 3.4 - The accompanying time series plot of movie box...Ch. 3.5 - The accompanying comparative bar chart is similar...Ch. 3.5 - Prob. 47ECh. 3.5 - The figure at the top right of the next page is...Ch. 3.5 - The two graphical displays below are similar to...Ch. 3.5 - The following graphical display is similar to one...Ch. 3.5 - Explain why the following graphical display...Ch. 3 - Prob. 52CRCh. 3 - Prob. 53CRCh. 3 - Prob. 54CRCh. 3 - The Connecticut Agricultural Experiment Station...Ch. 3 - The stem-and-leaf display of Exercise 3.55 uses...Ch. 3 - Prob. 57CRCh. 3 - Prob. 58CRCh. 3 - Does the size of a transplanted organ matter? A...Ch. 3 - Prob. 60CRCh. 3 - Prob. 61CRCh. 3 - Prob. 62CRCh. 3 - The article Tobacco and Alcohol Use in G-Rated...Ch. 3 - Prob. 64CRCh. 3 - Prob. 65CRCh. 3 - Prob. 66CRCh. 3 - Prob. 67CRCh. 3 - Prob. 68CRCh. 3 - Prob. 69CRCh. 3 - Many nutritional experts have expressed concern...Ch. 3 - Americium 241 (241Am) is a radioactive material...Ch. 3 - Does eating broccoli reduce the risk of prostate...Ch. 3 - An article that appeared in USA TODAY (August 11,...Ch. 3 - Sometimes samples are composed entirely of...Ch. 3 - Prob. 4CRECh. 3 - More than half of Californias doctors say they are...Ch. 3 - Based on observing more than 400 drivers in the...Ch. 3 - An article from the Associated Press (May 14,...Ch. 3 - Prob. 8CRECh. 3 - Prob. 9CRECh. 3 - Prob. 10CRECh. 3 - The article Determination of Most Representative...Ch. 3 - The paper Lessons from Pacemaker Implantations...Ch. 3 - How does the speed of a runner vary over the...Ch. 3 - Prob. 14CRECh. 3 - One factor in the development of tennis elbow, a...Ch. 3 - An article that appeared in USA TODAY (September...
Additional Math Textbook Solutions
Find more solutions based on key concepts
How much time do Americans living in or near cities spend waiting in traffic, and how much does waiting in traf...
Business Statistics: A First Course (7th Edition)
Four different beverages are sold at a fast-food restaurant: soft drinks, tea, coffee, and bottled water. a. Ex...
Basic Business Statistics, Student Value Edition
Why is it difficult to define quality?
Introduction to Statistical Quality Control
A Pew Research Center survey found a noticeable rise in smartphone ownership and internet usage in emerging and...
Business Statistics: A First Course (8th Edition)
The data in Table 1A were collected from one of the authors’ statistics classes. The first row gives the variab...
Introductory Statistics
Empirical versus Theoretical A Monopoly player claims that the probability of getting a 4 when rolling a six-si...
Introductory Statistics (2nd Edition)
Knowledge Booster


Learn more about
Need a deep-dive on the concept behind this application? Look no further. Learn more about this topic, statistics and related others by exploring similar questions and additional content below.Similar questions
- The question and answers are in the screenshot.arrow_forwardplease assist where the blank areas are on the table. Are there differences in airfare depending on which travel agency website you utilize? The following data were collected on travel agency websites on July , . The following table contains the prices in U.S. dollars for a one-way ticket between the cities listed on the left for each of the three travel agency websites. Here the pairs of cities are the blocks and the treatments are the different websites.arrow_forwardThe basketball coach at a local college believes that his team scores more points at home games when more people show up. Below is a list of all home games last year with scores and corresponding attendance. Use Excel, SPSS, or work by hand to show your work finding r. Show your work on the attached pages. Score Attendance Score Attendance 54 380 67 410 57 350 78 215 59 320 67 113 80 478 56 250 82 451 85 450 75 250 101 489 73 489 99 472 53 451 What is the obtained t-score for this correlation? What is the critical t-score for a two-tailed test with a = 0.05? Is this correlation significant based on the t-scores?arrow_forward
- A national park conducts a study on the behaviour of their leopards. A few of the park's leopards are registered and receive a GPS device which allows measuring the position of the leopard. Use this example to describe the following concepts: population, sample, observation, value, and variable.arrow_forwardRecently, management at Oak Tree Golf Course received a few complaints about the condition of the greens. Several players complained that the greens are too fast. Rather than react to the comments of just a few, the Golf Association conducted a survey of 100 male and 100 female golfers. The survey results are summarized here. Excel File: data02-31.xlsx Male Golfers Green Condition Gender Too Fast Male Handicap Under 15 15 or more 25 25 a. Complete the crosstabulation shown below. Green Condition Female Too Fast 10 Fine Fine 40 Female Golfers Total Green Condition Handicap Under 15 15 or more Too Fast 1 Fine 9 39 51 Total Which group shows the highest percentage saying that the greens are too fast? - Select your answer - b. Refer to the initial crosstabulations. For those players with low handicaps (better players), which group (male or female) shows the highest percentage saying the greens are too fast? For the low handicappers, the - Select your answer - have a higher percentage who…arrow_forwardAccording to a retail organization, holiday shoppers spent an average of $935.58 over the Thanksgiving weekend in 2016. The accompanying data show the amount spent by a random sample of holiday shoppers during the same weekend in 2017. Complete parts a through c.arrow_forward
arrow_back_ios
SEE MORE QUESTIONS
arrow_forward_ios
Recommended textbooks for you
 Algebra: Structure And Method, Book 1AlgebraISBN:9780395977224Author:Richard G. Brown, Mary P. Dolciani, Robert H. Sorgenfrey, William L. ColePublisher:McDougal Littell
 Algebra & Trigonometry with Analytic GeometryAlgebraISBN:9781133382119Author:SwokowskiPublisher:Cengage
 Glencoe Algebra 1, Student Edition, 9780079039897...AlgebraISBN:9780079039897Author:CarterPublisher:McGraw Hill
 Elementary Geometry for College StudentsGeometryISBN:9781285195698Author:Daniel C. Alexander, Geralyn M. KoeberleinPublisher:Cengage Learning
 Holt Mcdougal Larson Pre-algebra: Student Edition...AlgebraISBN:9780547587776Author:HOLT MCDOUGALPublisher:HOLT MCDOUGAL
Algebra: Structure And Method, Book 1
Algebra
ISBN:9780395977224
Author:Richard G. Brown, Mary P. Dolciani, Robert H. Sorgenfrey, William L. Cole
Publisher:McDougal Littell
Algebra & Trigonometry with Analytic Geometry
Algebra
ISBN:9781133382119
Author:Swokowski
Publisher:Cengage
Glencoe Algebra 1, Student Edition, 9780079039897...
Algebra
ISBN:9780079039897
Author:Carter
Publisher:McGraw Hill
Elementary Geometry for College Students
Geometry
ISBN:9781285195698
Author:Daniel C. Alexander, Geralyn M. Koeberlein
Publisher:Cengage Learning
Holt Mcdougal Larson Pre-algebra: Student Edition...
Algebra
ISBN:9780547587776
Author:HOLT MCDOUGAL
Publisher:HOLT MCDOUGAL
Points, Lines, Planes, Segments, & Rays - Collinear vs Coplanar Points - Geometry; Author: The Organic Chemistry Tutor;https://www.youtube.com/watch?v=dDWjhRfBsKM;License: Standard YouTube License, CC-BY
Naming Points, Lines, and Planes; Author: Florida PASS Program;https://www.youtube.com/watch?v=F-LxiLSSaLg;License: Standard YouTube License, CC-BY