
Introduction to Statistics and Data Analysis
5th Edition
ISBN: 9781305750999
Author: Peck Olson Devore
Publisher: CENGAGE C
expand_more
expand_more
format_list_bulleted
Videos
Textbook Question
Chapter 3, Problem 56CR
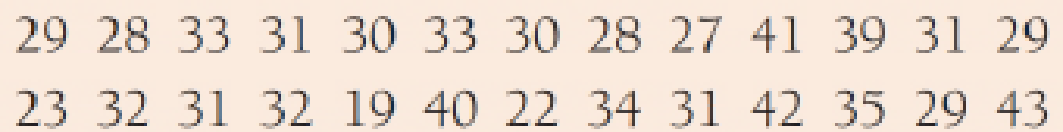
The stem-and-leaf display of Exercise 3.55 uses only four stems. Construct a stem-and-leaf display for these data using repeated stems 1H, 2L, 2H, … , 4L. For example, the first observation, 29, would have a stem of 2 and a leaf of 9. It would be entered into the display for the stem 2H, because it is a “high” 2—that is, it has a leaf that is on the high end (5, 6, 7, 8, 9).
3.55 The Connecticut Agricultural Experiment Station conducted a study of the calorie content of different types of beer. The calorie content (calories per 100 ml) for 26 brands of light beer are (from the web site brewery.org):
- a. Construct a stem-and-leaf display using stems 1, 2, 3, and 4.
- b. Write a sentence or two describing the calorie content of light beers.
Expert Solution & Answer
Want to see the full answer?
Check out a sample textbook solution
Students have asked these similar questions
In Exercises 33 to 36, determine whether or not the
conditions for using two-sample t procedures are met.
33. Shoes How many pairs of shoes do teenagers have?
To find out, a group of AP® Statistics students
conducted a survey. They selected a random sample
of 20 female students and a separate random sample
Females
333
95
4332
66
410
8
9
100
7
0
0
4455 WW~~
1
1
2 2
2
Males
4
3
555677778
0000124
3 58
Key: 22 represents
a male student with
22 pairs of shoes.
The exercise involving data in this and subsequent sections were designed to be solved using Excel. Johnson Filtration, Inc. provides maintenance service for water-filtration systems. Suppose that in addition to information on the number of months since the machine was serviced and whether a mechanical or an electrical repair was necessary, the managers obtained a list showing which repairperson performed the service. The revised data follow.
Repair Time(hours)
Months SinceLast Service
Type ofRepair
Repairperson
2.9
2
electrical
Dave Newton
3.0
6
mechanical
Dave Newton
4.8
8
electrical
Bob Jones
1.8
3
mechanical
Dave Newton
2.9
2
electrical
Dave Newton
4.9
7
electrical
Bob Jones
4.2
9
mechanical
Bob Jones
4.8
8
mechanical
Bob Jones
4.4
4
electrical
Bob Jones
4.5
6
electrical
Dave Newton
Ignore for now the months since the last maintenance service (x1 ) and the repairperson…
Nine students held their breath, once after breathing normally and relaxing for one minute, and once
after hyperventilating for one minute. The table indicates how long (in sec) they were able to hold
their breath. Is there an association between the two variables?
Chapter 3 Solutions
Introduction to Statistics and Data Analysis
Ch. 3.1 - Each person in a nationally representative sample...Ch. 3.1 - The graphical display on the next page is similar...Ch. 3.1 - Prob. 3ECh. 3.1 - The National Confectioners Association asked 1006...Ch. 3.1 - College student attitudes about e-books were...Ch. 3.1 - Prob. 6ECh. 3.1 - Prob. 7ECh. 3.1 - Prob. 8ECh. 3.1 - Prob. 9ECh. 3.1 - The survey on student attitude toward e-books...
Ch. 3.1 - Prob. 11ECh. 3.1 - Prob. 12ECh. 3.1 - An article about college loans (New Rules Would...Ch. 3.1 - Prob. 14ECh. 3.2 - Prob. 15ECh. 3.2 - Prob. 16ECh. 3.2 - Prob. 17ECh. 3.2 - The article Economy Low, Generosity High (USA...Ch. 3.2 - Prob. 19ECh. 3.2 - A report from Texas Transportation Institute...Ch. 3.2 - The percentage of teens not in school or working...Ch. 3.3 - Prob. 22ECh. 3.3 - The accompanying data on annual maximum wind speed...Ch. 3.3 - The accompanying relative frequency table is based...Ch. 3.3 - Prob. 25ECh. 3.3 - Medicares new medical plans offer a wide range of...Ch. 3.3 - The following two relative frequency distributions...Ch. 3.3 - Prob. 28ECh. 3.3 - The report Trends in College Pricing 2012...Ch. 3.3 - An exam is given to students in an introductory...Ch. 3.3 - The accompanying frequency distribution summarizes...Ch. 3.3 - Example 3.19 used annual rainfall data for...Ch. 3.3 - Prob. 33ECh. 3.3 - Prob. 34ECh. 3.3 - Prob. 35ECh. 3.3 - Prob. 36ECh. 3.3 - Using the five class intervals 100 to 120, 120 to...Ch. 3.4 - Prob. 38ECh. 3.4 - Consumer Reports Health (consumerreports.org) gave...Ch. 3.4 - Prob. 40ECh. 3.4 - Prob. 41ECh. 3.4 - Prob. 42ECh. 3.4 - Prob. 43ECh. 3.4 - Prob. 44ECh. 3.4 - The accompanying time series plot of movie box...Ch. 3.5 - The accompanying comparative bar chart is similar...Ch. 3.5 - Prob. 47ECh. 3.5 - The figure at the top right of the next page is...Ch. 3.5 - The two graphical displays below are similar to...Ch. 3.5 - The following graphical display is similar to one...Ch. 3.5 - Explain why the following graphical display...Ch. 3 - Prob. 52CRCh. 3 - Prob. 53CRCh. 3 - Prob. 54CRCh. 3 - The Connecticut Agricultural Experiment Station...Ch. 3 - The stem-and-leaf display of Exercise 3.55 uses...Ch. 3 - Prob. 57CRCh. 3 - Prob. 58CRCh. 3 - Does the size of a transplanted organ matter? A...Ch. 3 - Prob. 60CRCh. 3 - Prob. 61CRCh. 3 - Prob. 62CRCh. 3 - The article Tobacco and Alcohol Use in G-Rated...Ch. 3 - Prob. 64CRCh. 3 - Prob. 65CRCh. 3 - Prob. 66CRCh. 3 - Prob. 67CRCh. 3 - Prob. 68CRCh. 3 - Prob. 69CRCh. 3 - Many nutritional experts have expressed concern...Ch. 3 - Americium 241 (241Am) is a radioactive material...Ch. 3 - Does eating broccoli reduce the risk of prostate...Ch. 3 - An article that appeared in USA TODAY (August 11,...Ch. 3 - Sometimes samples are composed entirely of...Ch. 3 - Prob. 4CRECh. 3 - More than half of Californias doctors say they are...Ch. 3 - Based on observing more than 400 drivers in the...Ch. 3 - An article from the Associated Press (May 14,...Ch. 3 - Prob. 8CRECh. 3 - Prob. 9CRECh. 3 - Prob. 10CRECh. 3 - The article Determination of Most Representative...Ch. 3 - The paper Lessons from Pacemaker Implantations...Ch. 3 - How does the speed of a runner vary over the...Ch. 3 - Prob. 14CRECh. 3 - One factor in the development of tennis elbow, a...Ch. 3 - An article that appeared in USA TODAY (September...
Knowledge Booster


Learn more about
Need a deep-dive on the concept behind this application? Look no further. Learn more about this topic, statistics and related others by exploring similar questions and additional content below.Similar questions
- In a study, the effects of the mane of a male lion as a signal of quality to mates and rivals was explored. Four life-sized dummies of male lions provided a tool for testing female response to the unfamiliar lions whose manes varied by length (long or short) and color (blonde or dark). The female lions were observed to see whether they approached each of the four life-sized dummies. Complete parts (a) through (e) below. a. Identify the experimental units. Choose the correct answer below. The female lions The male dummies The mane colors The mane lengths Part 2 b. Identify the response variable. Choose the correct answer below. A. Whether or not (yes or no) the mane length affected how the female lions reacted to a male dummy. B. Whether or not (yes or no) the female lions approached the same dummies. C. Whether or not (yes or no) the female lions approached a male dummy. D. Whether or not…arrow_forward15 wheelchair users were randomly assigned to three groups with 5 in each group. These participants navigated in virtual-reality settings. Group 1 participants were in the virtual-reality setting (a building) as wheelchair users. Group 2 participants were in the virtual-reality setting in a wheelchair pushed by a walking person. Group 3 participants walked without aid in the virtual-reality setting. Joan measured the time each participant needed to complete the navigation of the virtual-reality setting. What is the independent variable(s)?arrow_forwardQ4B The British Department of Transportation studied to see if people avoid driving on Friday the 13th. They did a traffic count on a Friday and then again on a Friday the 13th at the same two locations ("Friday the 13th," 2013). The data for each location on the two different dates is in following table: Table: Traffic Count Dates 6th 13th 1990, July 139246 138548 1990, July 134012 132908 1991, September 137055 136018 1991, September 133732 131843 1991, December 123552 121641 1991, December 121139 118723 1992, March 128293 125532 1992, March 124631 120249 1992, November 124609 122770 1992, November 117584 117263 Let μ1 = mean traffic count on Friday the 6th. Let μ2 = mean traffic count on Friday the 13th. Estimate the mean difference in traffic count between the 6th and the 13th using a 90% level. (iv) Determine degrees of freedom for the sample of differences dfd : Enter value in…arrow_forward
- Researchers investigated two kinds of laugh tracks – one with posed laughter and one with spontaneous laughter. Recall that to create the posed laughter laugh track, the researchers asked people to laugh and recorded the results. The researchers also tested the same 40 jokes with a spontaneous laughing laugh track, which they created by having people watch funny videos and recording their laughter. The data can be found in the file LaughTypes in pictures. Put these data into the Matched Pairs applet to investigate whether the type of laughter makes a difference in the ratings of the jokes and also do parts (a) (b) and (c):arrow_forwardA study by a reputable research group captured multitasking activities of adults who use different devices while watching TV. The study reported that 320 of 442 (72%) smartphone users sampled, 192 of 350 (55%) computer users sampled, and 139 of 260 (53%)tablet users sampled used their device to check social media unrelated to the video content while watching TV. Complete parts (a) through (c) below. a. Is there evidence of a significant difference among the smartphone, computer, and tablet users with respect to the proportion who use their device to check social media unrelated to the video content while watching TV? (Use α=0.10.) Your answer is correct. The test statistic is χ2STAT=35.860 The critical value for α=0.10 Please help and explain how to achieve critical valuearrow_forwardA study by a reputable research group captured multitasking activities of adults who use different devices while watching TV. The study reported that 320 of 442 (72%) smartphone users sampled, 192 of 350 (55%)computer users sampled, and 139 of 260 (53%) tablet users sampled used their device to check social media unrelated to the video content while watching TV. Complete parts (a) through (c) below. a. Is there evidence of a significant difference among the smartphone, computer, and tablet users with respect to the proportion who use their device to check social media unrelated to the video content while watching TV? (Use α=0.10.) The test statistic is χ2STAT= Find X2STAT Please show me the process of how you find this.arrow_forward
- A professional skydiver accompanies many customers each day on jumps. The amount of time spent in free fall is fairly consistent, but can be affected by factors such as wind speed. The length of time (in minutes) spent in free fall for the past five jumps is as follows. 2.17, 2.75, 1.48, 1.87, 1.58 Calculate the average length of time (in minutes) spent in free fall for the given jumps. minutes. Round your answer to two decimal places. Calculate the standard deviation of the length (in minutes) of time spent in free fall for the given minutes jumps. (Round your answer to three decimal places.)arrow_forwardcompare the two set-ups togther.arrow_forwardThe following table was generated from the sample data of 1010 junior high students regarding the average number of hours they are unsupervised per night, the average number of hours they play video games per night, and their final grades in their math class. The dependent variable is the final grade, the first independent variable (x1x1) is the number of hours unsupervised each night, and the second independent variable (x2x2) is the number of hours of video games each night. Coefficients Standard Error t-Stat p-value Intercept 64.49590764.495907 5.9533305.953330 10.83358510.833585 0.0000370.000037 Hours Unsupervised −0.974079−0.974079 1.1097971.109797 −0.877709−0.877709 0.4138620.413862 Hours Playing Video Games 4.9768084.976808 1.0636721.063672 4.6788924.678892 0.0034000.003400 Step 1 of 2: Write the multiple regression equation for the computer output given. Round your answers to three decimal places. Step 2 of 2: Indicate if any of the independent variables…arrow_forward
- The following table was generated from the sample data of 1010 junior high students regarding the average number of hours they are unsupervised per night, the average number of hours they play video games per night, and their final grades in their math class. The dependent variable is the final grade, the first independent variable (x1x1) is the number of hours unsupervised each night, and the second independent variable (x2x2) is the number of hours of video games each night. Coefficients Standard Error t-Stat p-value Intercept 57.968435 7.227955 8.020032 0.000201 Hours Unsupervised 5.131630 1.314283 3.904510 0.007943 Hours Playing Video Games 1.067855 1.615039 0.661194 0.533040 Write the multiple regression equation for the computer output given. Round your answers to three decimal places.arrow_forwardAccording to a Pew report, 14.6% of newly married couples in 2008 reported that their spouse was of another race or ethnicity (CNNLiving, June 7, 2010). In a similar survey in 1980, only 6.8% of newlywed couples reported marrying outside their race or ethnicity. Suppose both of these surveys were conducted on 500 newly married couples. (You may find it useful to reference the appropriate table: z table or t table) Let p1 represent the population proportion in 2008 and p2 the population proportion in 1980. a. Specify the competing hypotheses to test the claim that there is an increase in the proportion of people who marry outside their race or ethnicity. multiple choice 1 H0: p1 − p2 = 0; HA: p1 − p2 ≠ 0 H0: p1 − p2 ≤ 0; HA: p1 − p2 > 0 H0: p1 − p2 ≥ 0; HA: p1 − p2 < 0 b-1. Calculate the value of the test statistic. (Round intermediate calculations to at least 4 decimal places and final answers to 2 decimal places.) b-2. Find the p-value. multiple…arrow_forwardC. Describe the four characteristics of associationarrow_forward
arrow_back_ios
SEE MORE QUESTIONS
arrow_forward_ios
Recommended textbooks for you
 Glencoe Algebra 1, Student Edition, 9780079039897...AlgebraISBN:9780079039897Author:CarterPublisher:McGraw Hill
 Big Ideas Math A Bridge To Success Algebra 1: Stu...AlgebraISBN:9781680331141Author:HOUGHTON MIFFLIN HARCOURTPublisher:Houghton Mifflin Harcourt
 Holt Mcdougal Larson Pre-algebra: Student Edition...AlgebraISBN:9780547587776Author:HOLT MCDOUGALPublisher:HOLT MCDOUGAL
 Mathematics For Machine TechnologyAdvanced MathISBN:9781337798310Author:Peterson, John.Publisher:Cengage Learning,
Glencoe Algebra 1, Student Edition, 9780079039897...
Algebra
ISBN:9780079039897
Author:Carter
Publisher:McGraw Hill
Big Ideas Math A Bridge To Success Algebra 1: Stu...
Algebra
ISBN:9781680331141
Author:HOUGHTON MIFFLIN HARCOURT
Publisher:Houghton Mifflin Harcourt
Holt Mcdougal Larson Pre-algebra: Student Edition...
Algebra
ISBN:9780547587776
Author:HOLT MCDOUGAL
Publisher:HOLT MCDOUGAL
Mathematics For Machine Technology
Advanced Math
ISBN:9781337798310
Author:Peterson, John.
Publisher:Cengage Learning,
Introduction to experimental design and analysis of variance (ANOVA); Author: Dr. Bharatendra Rai;https://www.youtube.com/watch?v=vSFo1MwLoxU;License: Standard YouTube License, CC-BY