
Concept explainers
Videos
(a)
The year for which the number of permits was greatest when the number of housing permits (in thousands) issued by a country in Texas between year

(b)
The number of permits country issued in year
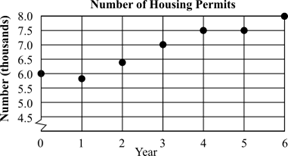
(c)
The years in which number of permits decreased when the number of housing permits (in thousands) issued by a country in Texas between year

(d)
The two years between which number of permits remained the same when the number of housing permits (in thousands) issued by a country in Texas between year
(e)
The year which corresponds to
Want to see the full answer?
Check out a sample textbook solution
Chapter 3 Solutions
LC BEG & INT ALGEBRA


- Suppose classmates who graduated in 2004 compared their median incomes ten years later. The bar graph displays the median income, in thousands of dollars, for each classmate during the time intervals from 2005‑2009 and 2010‑2014. For the individual with the largest dollar value increase in median income over the two time intervals, determine the amount of increase.arrow_forwardComplete the following table: LU 6-2(3) 6–50. 6–51.arrow_forwardQ. Table gives data on gold prices, the Consumer Price Index (CPI), and the New York Stock Exchange (NYSE) Index for the United States for the period 1974 –2006. The NYSE Index includes most of the stocks listed on the NYSE, some 1500-plus. a. Plot in the same scattergram gold prices, CPI, and the NYSE Index. b. An investment is supposed to be a hedge against inflation if its price and /or rate of return at least keeps pace with inflation. To test this hypothesis, suppose you decide to fit the following model, assuming the scatterplot in (a) suggests that this is appropriate: Gold pricet = β1 + β2 CPIt + ut NYSE indext = β1 + β2 CPIt + ut Note that if beta2 = 1 the response exactly grows with CPI Thank you!arrow_forward
- Answer question 3. stepwise.arrow_forwardThe table below shows a recent graduate's credit card balance each month after graduation. Month 1 2 3 4 5 6 7 8 Debt ($) 620.00 761.88 899.80 1039.93 1270.63 1589.04 1851.31 2154.92 a) Look at the graph on your calculator. Based on this graph, what type of equation should represent this situation? Explain your answer. b) Use your calculator to find the equation that you feel best fits this data. What is the equation? c) Based on this equation, what is the predicted amount of debt for month 9 after graduation? View keyboard shortcuts EditViewInsertFormatToolsTable 12pt Paragrapharrow_forwardThe table below shows a recent graduate's credit card balance each month after graduation. Month 1 2 3 4 5 6 7 8 Debt ($) 620.00 761.88 899.80 1039.93 1270.63 1589.04 1851.31 2154.92 a) Look at the graph on your calculator. Based on this graph, what type of equation should represent this situation? Explain your answer. b) Use your calculator to find the equation that you feel best fits this data. What is the equation? c) Based on this equation, what is the predicted amount of debt for month 9 after graduation?arrow_forward
- 2. Determine if the following graphs represent a linear, quadratic, or exponential relationship.arrow_forwardGraph. 1. 2. 1 A. -6-5 -4 -3 -3, -5. -6arrow_forwardThe line graphs in Figure show the percentages of marriages ending in divorce based on the wife’s age at marriage.Here are two mathematical models that approximate the data displayed by the line graphs:In each model, the variable n is the number of years after marriage and the variable d is the percentage of marriages ending in divorce.a. Use the appropriate formula to determine the percentage of marriagesending in divorce after 10 years when the wife is over 25 at the time ofmarriage.b. Use the appropriate line graph in Figure to determine the percentageof marriages ending in divorce after 10 years when the wife is over 25 at the time of marriage.c. Does the value given by the mathematical model underestimate or overestimate the actual percentage of marriages ending in divorce after10 years as shown by the graph? By how much?arrow_forward
- In 2011, home prices and mortgage rates fell so far that in a number of cities the monthly cost of owning a home was less expensive than renting. The following data show the average asking rent and the monthly mortgage on the median-priced home (including taxes and insurance) for 10 cities where the average monthly mortgage payment was less than the average asking rent (The Wall Street Journal, November 26–27, 2011). 7. City Rent ($) Mortgage ($) Atlanta 840 539 1062 1002 Chicago Detroit 823 626 DATA file Jacksonville, Fla. Las Vegas 779 711 796 655 RentMortgage 1071 953 Miami 977 Minneapolis Orlando, Fla. 776 851 695 762 651 654 Phoenix St. Louis 723 Develop a scatter diagram for these data, treating the average asking rent as the inde- pendent variable. Does a simple linear regression model appear to be appropriate? b. Use a simple linear regression model to develop an estimated regression equation to predict the monthly mortgage on the median-priced home given the average asking…arrow_forwardBetween 1980 and 2012, the number of adults in a certain country who were overweight more than tripled from 18% to 56%. Use this information to answer parts a and b. (a) Construct a graphic that is not misleading to depict this situation. Choose the correct graph below. OA. 1980 2012 1980 2012 1980 2012 1980 2012 (b) Construct a misleading graphic that makes it appear that the percent of overweight adults has more than quadrupled between 1980 and 2012. Choose the correct graph below. O A. Oc. OD. 50 40 304 20 10 1980 2012 1980 2012 1980 2012 1980 2012 ti n deuun Percentage ateun adesundarrow_forwardThe figure below shows a plot of Healthcare Expenditure per capita in 2019 and Life Expectancy according to data sourced from the World Bank with regions around the world being colour-coded (e.g. Australia, which is in Oceania, has health expenditure per capita of $5,427 and life expectancy of 83.2 years). In no more than 200 words, describe the patterns that you see in this figure.arrow_forward
 Algebra and Trigonometry (6th Edition)AlgebraISBN:9780134463216Author:Robert F. BlitzerPublisher:PEARSON
 Contemporary Abstract AlgebraAlgebraISBN:9781305657960Author:Joseph GallianPublisher:Cengage Learning
 Linear Algebra: A Modern IntroductionAlgebraISBN:9781285463247Author:David PoolePublisher:Cengage Learning
 Algebra And Trigonometry (11th Edition)AlgebraISBN:9780135163078Author:Michael SullivanPublisher:PEARSON
 Introduction to Linear Algebra, Fifth EditionAlgebraISBN:9780980232776Author:Gilbert StrangPublisher:Wellesley-Cambridge Press
 College Algebra (Collegiate Math)AlgebraISBN:9780077836344Author:Julie Miller, Donna GerkenPublisher:McGraw-Hill Education